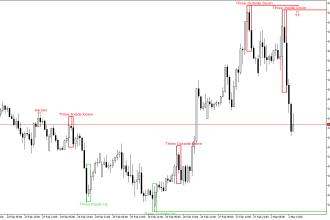
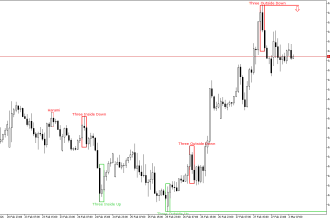
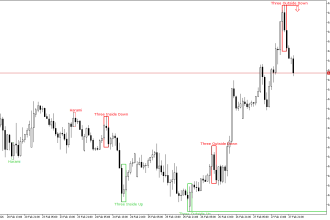
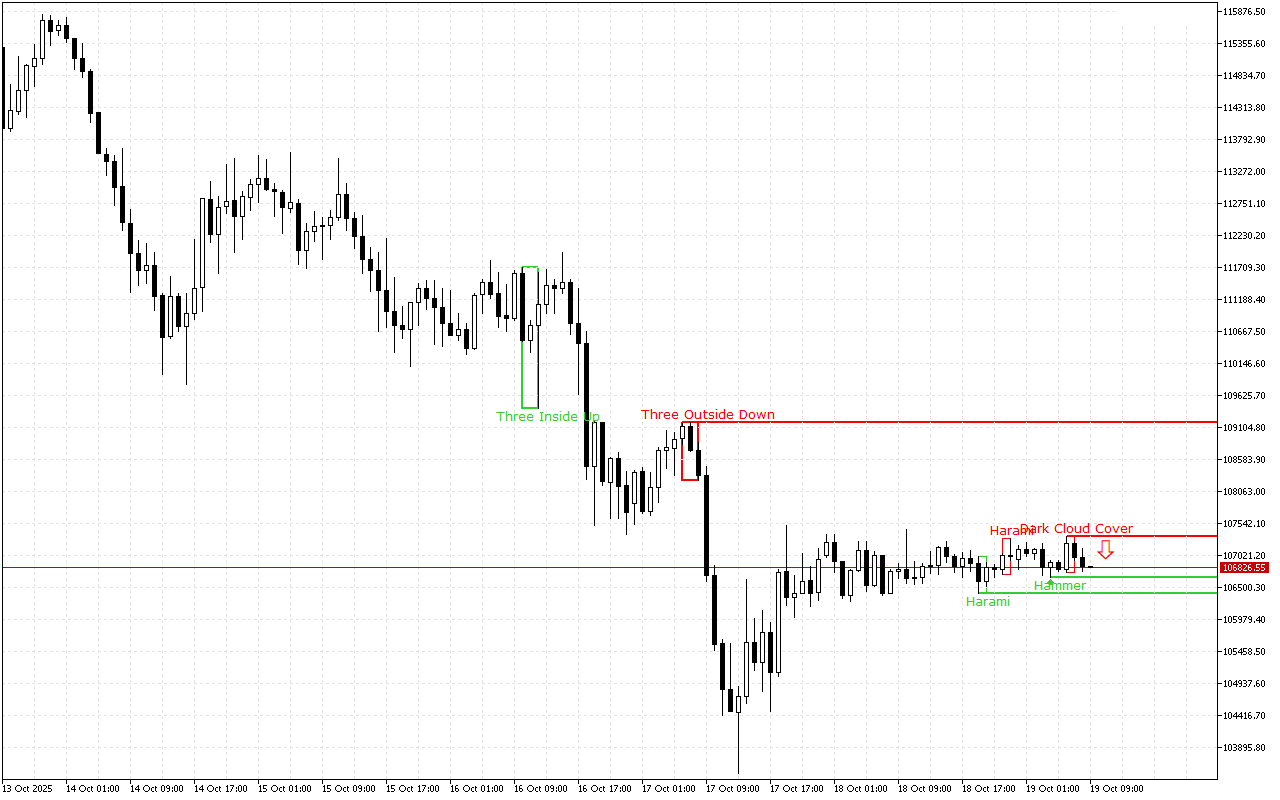
During the previous trading session, the price of Bitcoin decreased, moving in the main trend direction on the higher time-frame.
The support and resistance levels:
The nearest support level is at the price level of the 106667.85.
This level was formed by the Hammer pattern, also known as the Pin Bar pattern. This pattern is represented with a single Japanese candlestick which is composed of a small real body and a long lower shadow.
The nearest significant resistance level is at the 107332.45 mark.
This level was formed by the Dark Cloud Cover pattern. The pattern consists of two candles: the first candle is long and white, and the second is black. The second one opens with a gap up and closes below the middle of the real body of the first candle.
Trading recommendations:
The latest pattern formed on the chart prioritizes short positions. This signal is also proved with the price movement dynamics on the higher time-frame.
Bitcoin H1: The Price Action Forecast for the European Session on 19.10.2025
Previous Article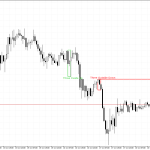 Next Article
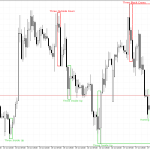
Bitcoin H1: The Price Action Forecast for the Asian Session at 19.10.2025
EURGBP H1: The Price Action Forecast for the European Session on 20.10.2025