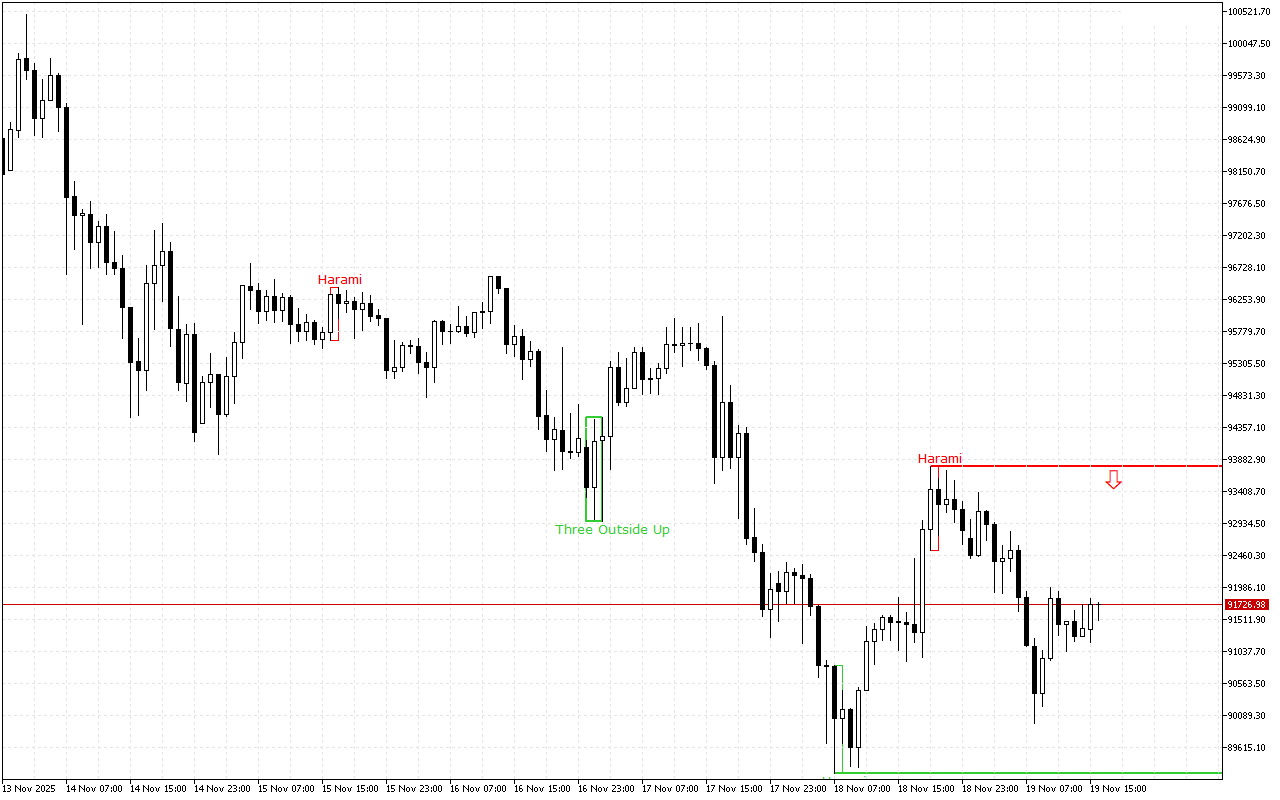
Bitcoin closes the last trading session in the green zone, while the downward price movement vector prevails on the higher time-frame.
The support and resistance levels:
The support level is near the 89229.85 mark.
This level was formed by the Bullish Harami pattern. The pattern is represented with two Japanese candles, where the second one with a smaller real body is inside the body of the first one.
The resistance level is near the 93785.43 mark.
This level was formed by the Bearish Harami pattern, which is presented with two Japanese candlesticks where the second candlestick with a smaller real body is inside the body of the first one.
Trading recommendations:
During the day, it is worth considering the possibilities for opening short positions. This is indicated by both: the dynamics of price movement over a longer distance and the latest formed pattern.
Bitcoin H1: The Price Action Forecast for the American Session on 19.11.2025
Previous Article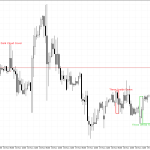 Next Article
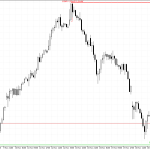
EURGBP H1: The Price Action Forecast for the American Session on 19.11.2025
CAC 40 H1: The Price Action Forecast for the American Session on 19.11.2025