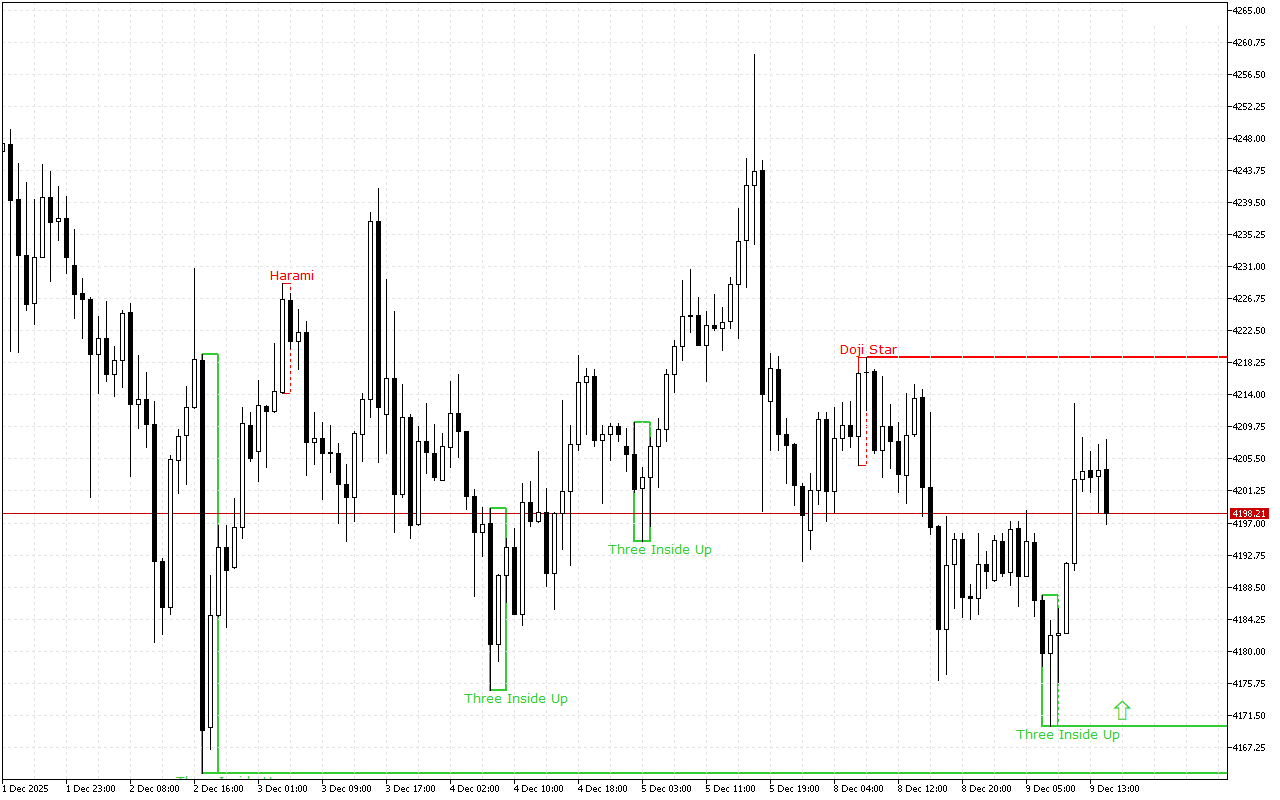
During the previous trading session, the positive dynamics of the XAUUSD movement were seen. On a longer time-frame, the upward price movement vector also prevails.
The support and resistance levels:
The nearest support level is at the price level of the 4170.05.
This level was formed by the Three Inside Up pattern. This pattern consists of three Japanese candles: the first candle has a short white real body, the second candle has a white real body and is completely inside the body of the first candle, and the third candle is also white and closes above the body of the second candle.
The nearest significant resistance level is at the 4218.95 mark.
This level is formed by the Bearish Doji Star pattern. This pattern has a fairly high confirmation rate. It consists of two Japanese candles, where the second is a doji, which opens with a gap down.
Trading recommendations:
The price movement dynamics for a longer period of time as well as the latest signals on the chart indicate the long positions opening intraday. The entry points can be considered from the nearest support levels.
XAUUSD H1: The Price Action Forecast for the American Session on 9.12.2025
Previous Article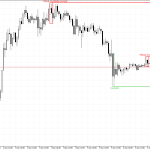 Next Article
Bitcoin H1: The Price Action Forecast for the American Session on 9.12.2025
EURUSD H1: The Price Action Forecast for the American Session on 9.12.2025