During the previous trading session, the positive dynamics of the EURGBP movement were seen. On a longer time-frame, the upward price movement vector also prevails.
The support and resistance levels:
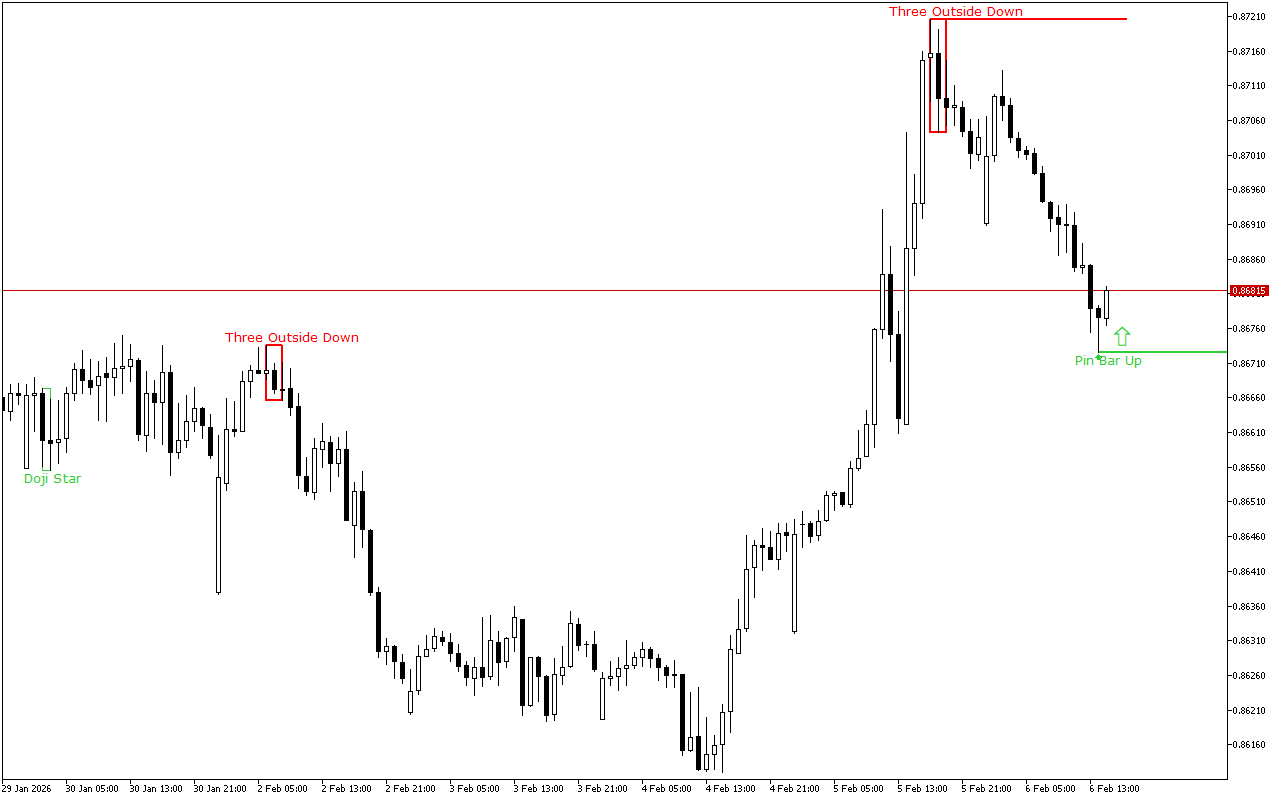
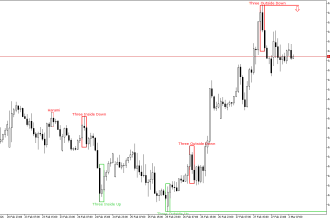
The current support level is in the area of the 0.86726 mark.
This level is formed due to the appearance of the Pin Bar pattern. This pattern is represented with a candle with a small real body and a long lower shadow. This pattern is quite common at strong support levels.
The current resistance level is at the 0.87206 mark.
The pattern formed here is Three Outside Bars Down. This pattern is a combination of three Japanese candlesticks. The first candlestick has a short white real body, the second candlestick has a long black real body and completely engulfs the first candlestick, and the third candlestick is also black, closing below the second candlestick.
Trading recommendations:
On the higher time-frame, the upward price dynamics prevail. The last signal on the chart also indicates the upcoming growth. Against this background, it is worth prioritizing the buy signals during the day.
EURGBP H1: The Price Action Forecast for the American Session on 6.2.2026
Previous Article Next Article
EURUSD H1: The Price Action Forecast for the American Session on 6.2.2026
XAUUSD H1: The Price Action Forecast for the Asian Session at 9.2.2026
Related Posts
EURGBP H1: The Price Action Forecast for the European Session on ...
March 2, 2026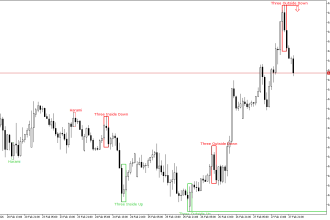
EURGBP H1: The Price Action Forecast for the Asian Session at 2.3 ...
February 27, 2026