During the previous trading session, the positive dynamics of the XAUUSD movement were seen. On a longer time-frame, the upward price movement vector also prevails.
The support and resistance levels:
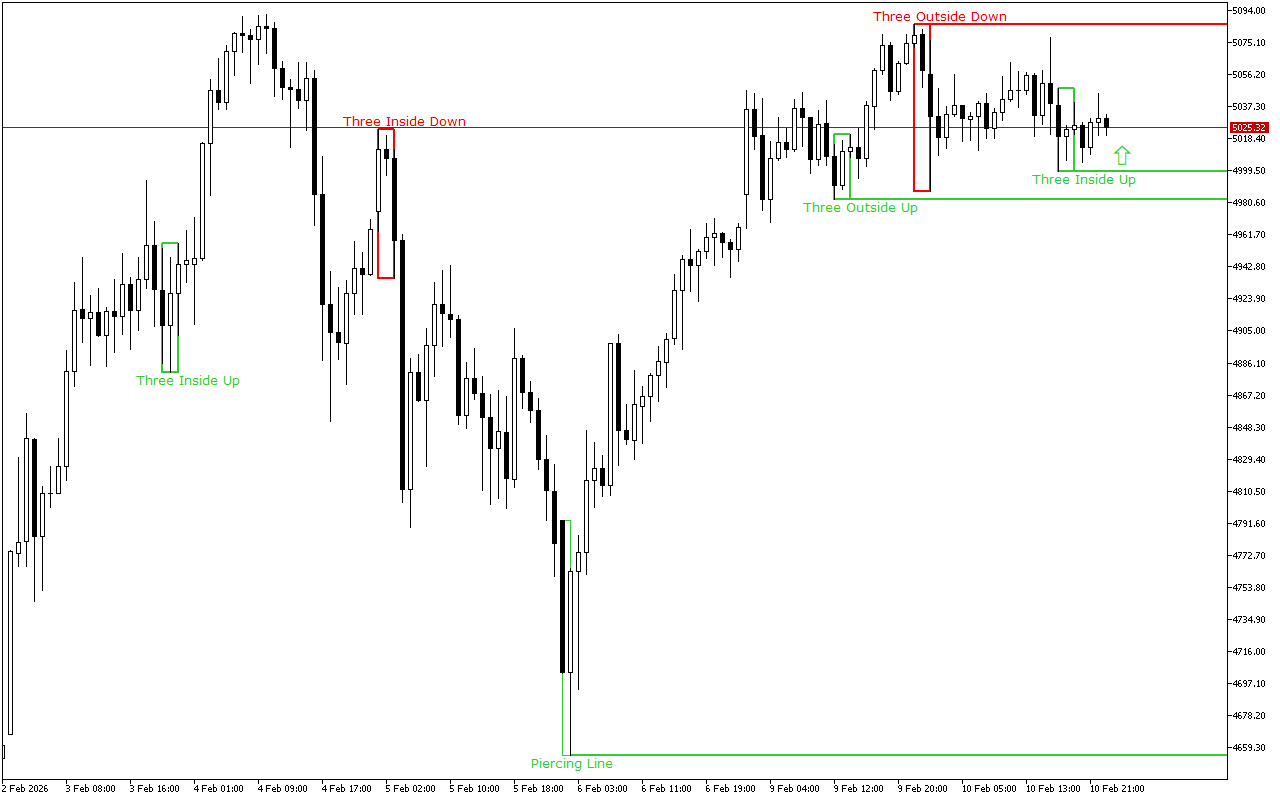
The closest support to the price is at the 4998.91 mark.
This level was formed by the Three Inside Up pattern. This pattern consists of three Japanese candles: the first candle has a short white real body, the second candle has a white real body and is completely inside the body of the first candle, and the third candle is also white and closes above the body of the second candle.
The nearest resistance level is at the level of the 5086.
The pattern formed here is Three Outside Bars Down. This pattern is a combination of three Japanese candlesticks. The first candlestick has a short white real body, the second candlestick has a long black real body and completely engulfs the first candlestick, and the third candlestick is also black, closing below the second candlestick.
Trading recommendations:
On the higher time-frame, the upward price dynamics prevail. The last signal on the chart also indicates the upcoming growth. Against this background, it is worth prioritizing the buy signals during the day.
XAUUSD H1: The Price Action Forecast for the Asian Session at 11.2.2026