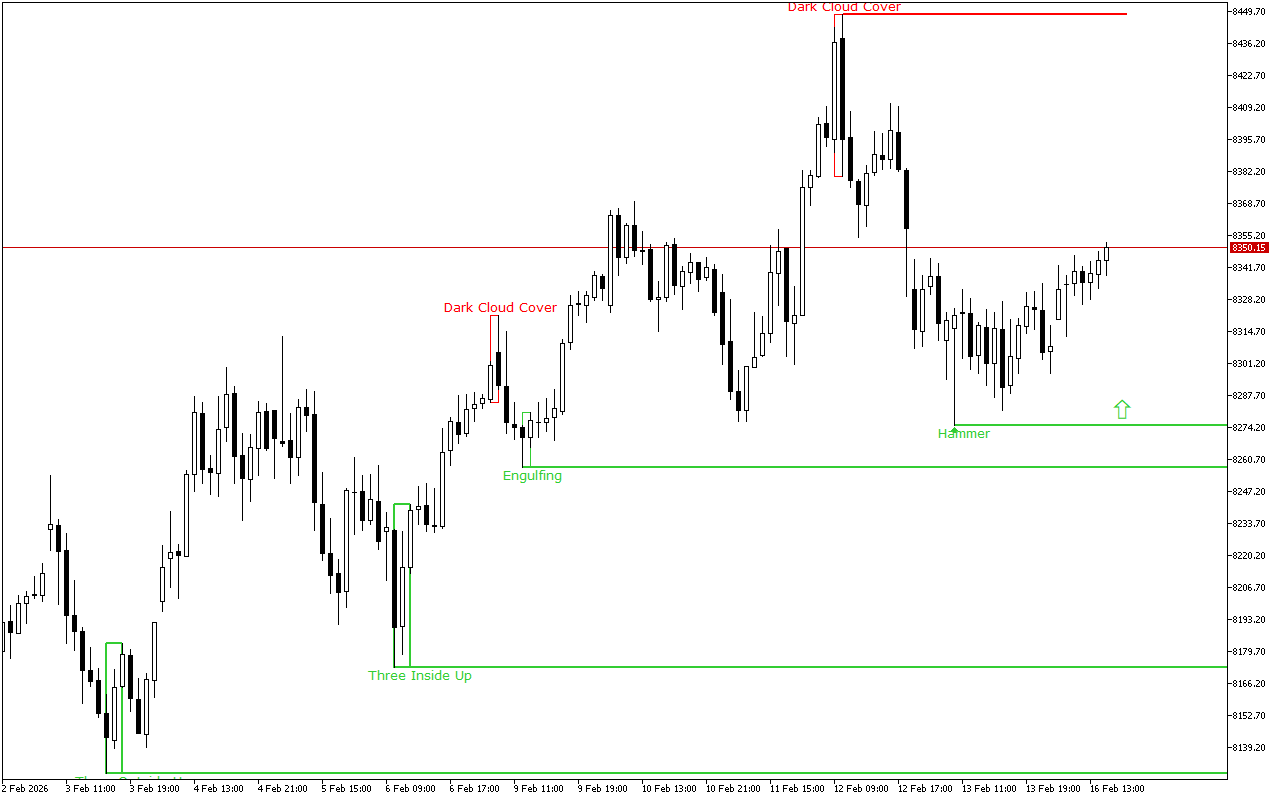
During the previous trading session, CAC 40 demonstrated downward dynamics. On a longer time-frame, the upward trend still prevails.
The support and resistance levels:
The closest support to the price is at the 8274.84 mark.
This level was formed by the Hammer pattern, also known as the Pin Bar pattern. This pattern is represented with a single Japanese candlestick which is composed of a small real body and a long lower shadow.
The nearest resistance level is at the level of the 8448.41.
This level was formed by the Dark Cloud Cover pattern. The pattern consists of two candles: the first candle is long and white, and the second is black. The second one opens with a gap up and closes below the middle of the real body of the first candle.
Trading recommendations:
The price movement dynamics for a longer period of time as well as the latest signals on the chart indicate the long positions opening intraday. The entry points can be considered from the nearest support levels.
CAC 40 H1: The Price Action Forecast for the American Session on 16.2.2026
Previous Article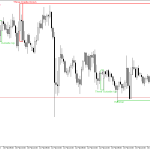 Next Article
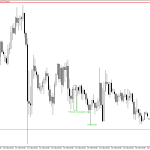
EURUSD H1: The Price Action Forecast for the American Session on 16.2.2026
EURUSD H1: The Price Action Forecast for the European Session on 17.2.2026