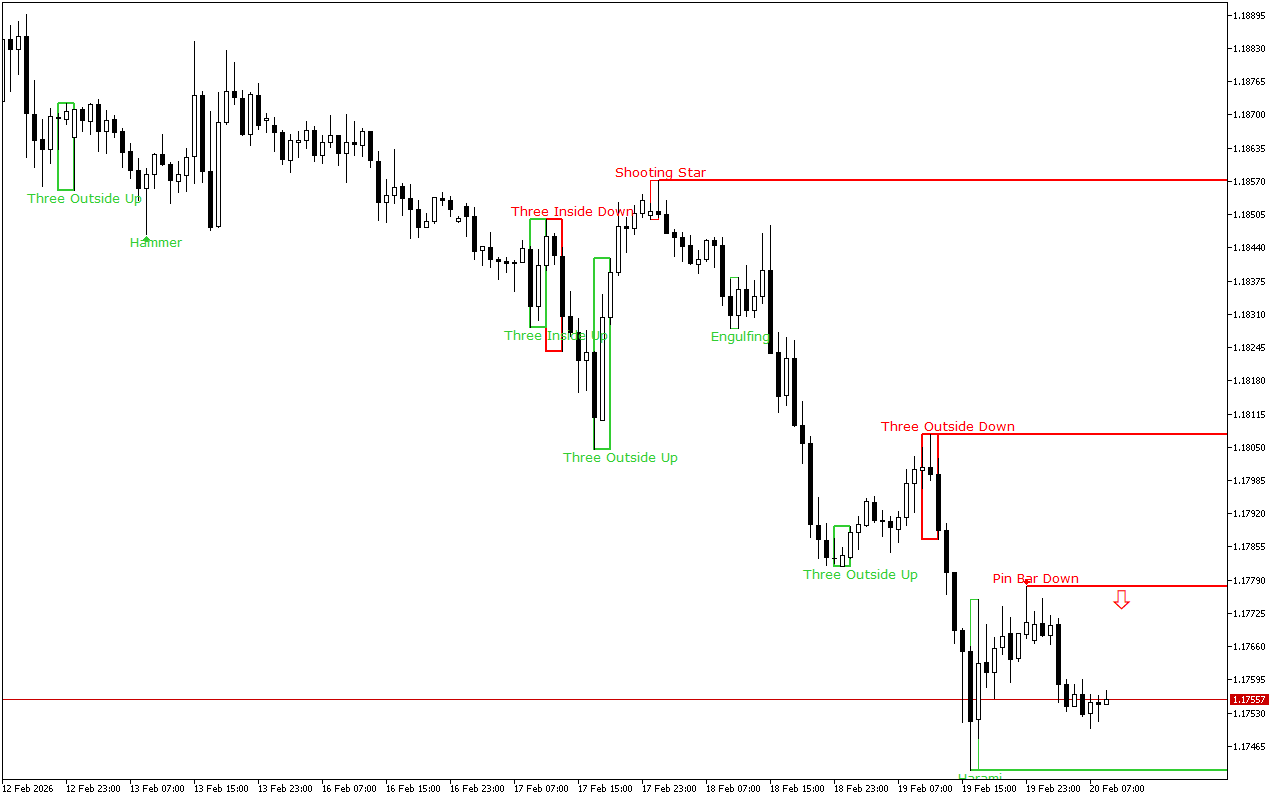
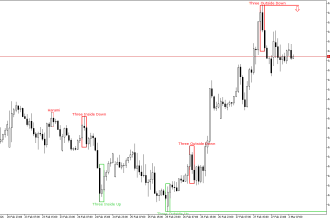
During the previous trading session, the price of EURUSD decreased, moving in the main trend direction on the higher time-frame.
The support and resistance levels:
The nearest support level is at the price level of the 1.17417.
This level was formed by the Bullish Harami pattern. The pattern is represented with two Japanese candles, where the second one with a smaller real body is inside the body of the first one.
The nearest significant resistance level is at the 1.17778 mark.
This level was formed by a Pin Bar pattern. This pattern is presented with a single Japanese candle with a small real body and a long upper shadow. This is one of the key patterns in the Price Action system.
Trading recommendations:
During the day, it is worth considering the possibilities for opening short positions. This is indicated by both: the dynamics of price movement over a longer distance and the latest formed pattern.
EURUSD H1: The Price Action Forecast for the European Session on 20.2.2026
Previous Article Next Article
EURUSD H1: The Price Action Forecast for the Asian Session at 20.2.2026
XAUUSD H1: The Price Action Forecast for the American Session on 20.2.2026
Related Posts
EURGBP H1: The Price Action Forecast for the European Session on ...
March 2, 2026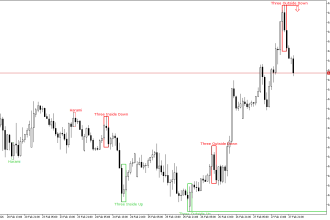
EURGBP H1: The Price Action Forecast for the Asian Session at 2.3 ...
February 27, 2026