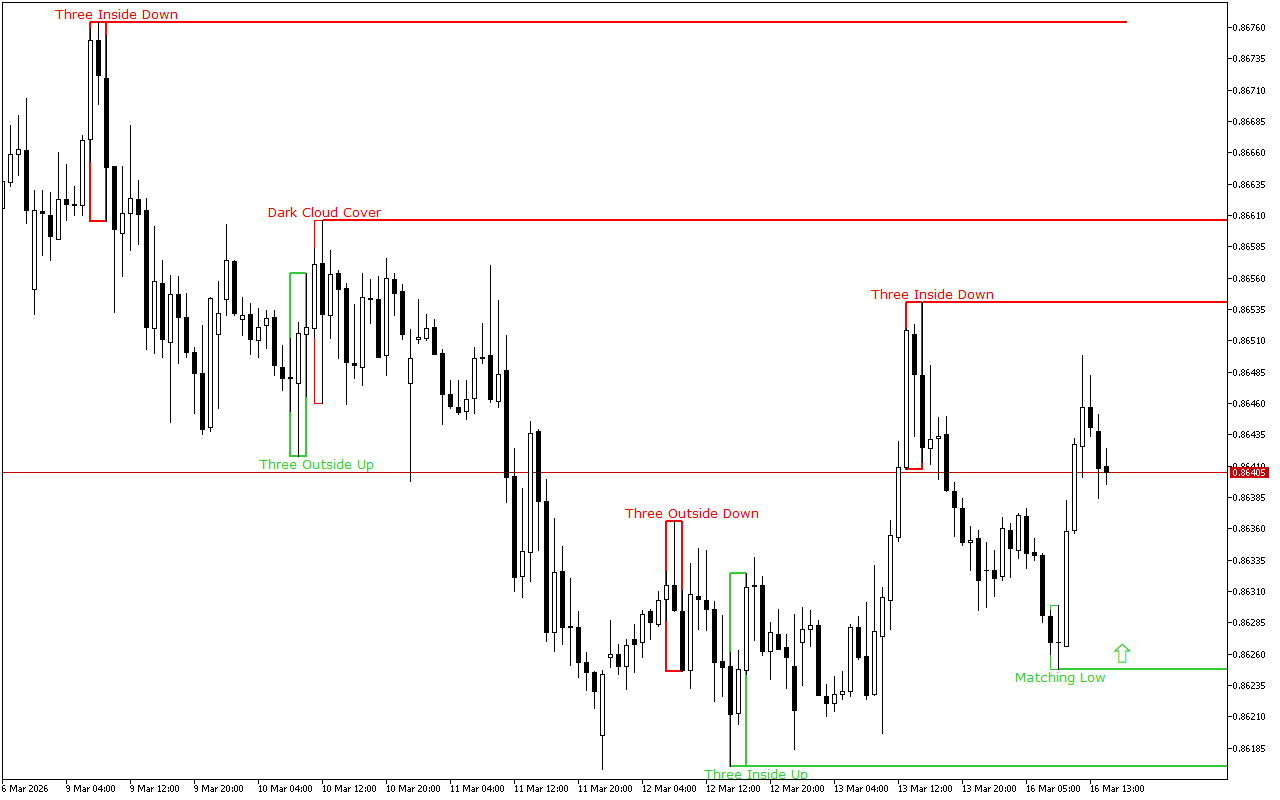
EURGBP closes the last trading session in the green zone, while the downward price movement vector prevails on the higher time-frame.
The support and resistance levels:
The closest support to the price is at the 0.86248 mark.
This level was formed by the Bullish Matching Low pattern. This pattern is represented with two consecutive Japanese candles, which closing prices are low and are almost at the same level.
The nearest resistance level is at the level of the 0.86541.
This level was formed by the Three Inside Down pattern. This pattern consists of three Japanese candles: the first candle has a short black real body, the second candle also has a black real body and is completely inside the body of the first candle, and the third candle is also black and closes below the body of the second candle.
Trading recommendations:
The latest signal on the chart indicates the prevalence of the long positions. This signal is valid, until the other pattern is formed.
EURGBP H1: The Price Action Forecast for the American Session on 16.3.2026
Previous Article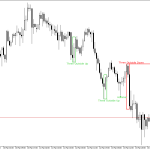 Next Article
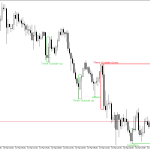
XAUUSD H1: The Price Action Forecast for the American Session on 16.3.2026
XAUUSD H1: The Price Action Forecast for the European Session on 17.3.2026