During the previous trading session, EURUSD demonstrated downward dynamics. On a longer time-frame, the upward trend still prevails.
The support and resistance levels:
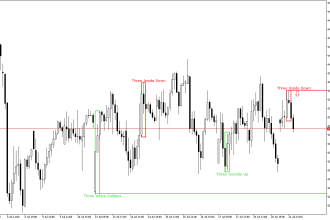
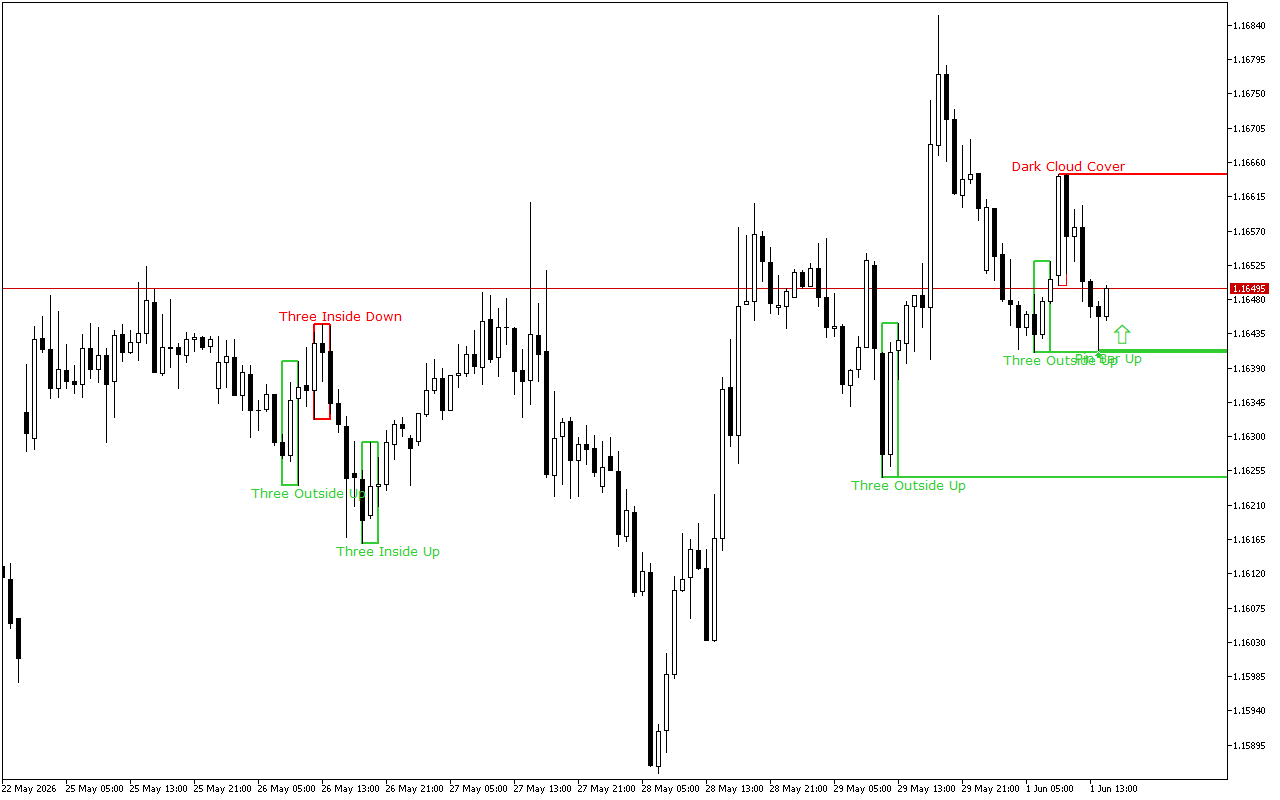
The support level is near the 1.16413 mark.
This level is formed due to the appearance of the Pin Bar pattern. This pattern is represented with a candle with a small real body and a long lower shadow. This pattern is quite common at strong support levels.
The resistance level is near the 1.16644 mark.
This level was formed by the Dark Cloud Cover pattern. The pattern consists of two candles: the first candle is long and white, and the second is black. The second one opens with a gap up and closes below the middle of the real body of the first candle.
Trading recommendations:
On the higher time-frame, the upward price dynamics prevail. The last signal on the chart also indicates the upcoming growth. Against this background, it is worth prioritizing the buy signals during the day.
EURUSD H1: The Price Action Forecast for the American Session on 1.6.2026
Previous Article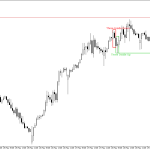 Next Article
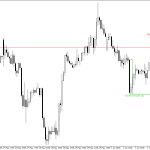
EURGBP H1: The Price Action Forecast for the American Session on 29.5.2026
XAUUSD H1: The Price Action Forecast for the American Session on 2.6.2026