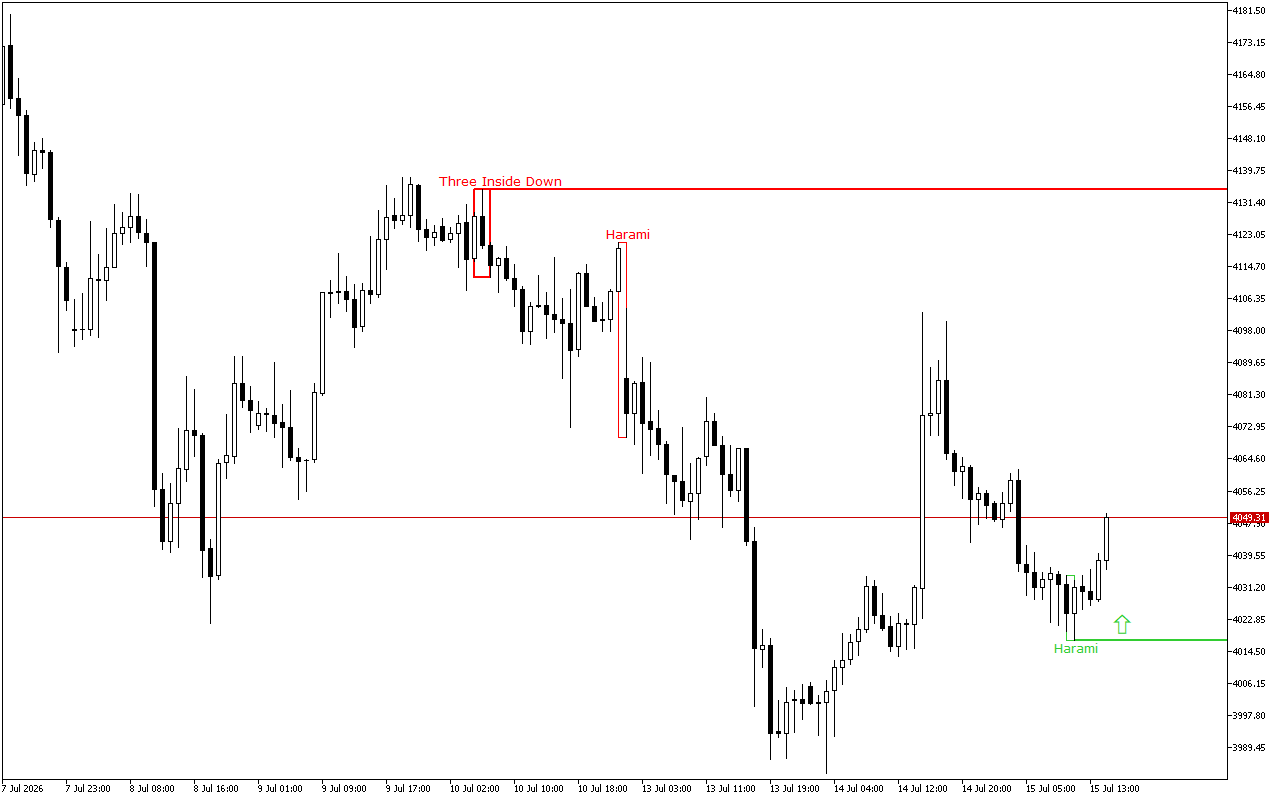
XAUUSD closes the last trading session in the green zone, while the downward price movement vector prevails on the higher time-frame.
The support and resistance levels:
The nearest support is set at the 4017.26 mark.
This level was formed by the Bullish Harami pattern. The pattern is represented with two Japanese candles, where the second one with a smaller real body is inside the body of the first one.
The nearest resistance is set at the 4120.9 mark.
This level was formed by the Bearish Harami pattern, which is presented with two Japanese candlesticks where the second candlestick with a smaller real body is inside the body of the first one.
Trading recommendations:
The latest signal on the chart indicates the prevalence of the long positions. This signal is valid, until the other pattern is formed.
XAUUSD H1: The Price Action Forecast for the American Session on 15.7.2026
Previous Article Next Article
EURGBP H1: The Price Action Forecast for the European Session on 15.7.2026
CAC 40 H1: The Price Action Forecast for the American Session on 15.7.2026