During the previous trading session, the price of Bitcoin decreased, moving in the main trend direction on the higher time-frame.
The support and resistance levels:
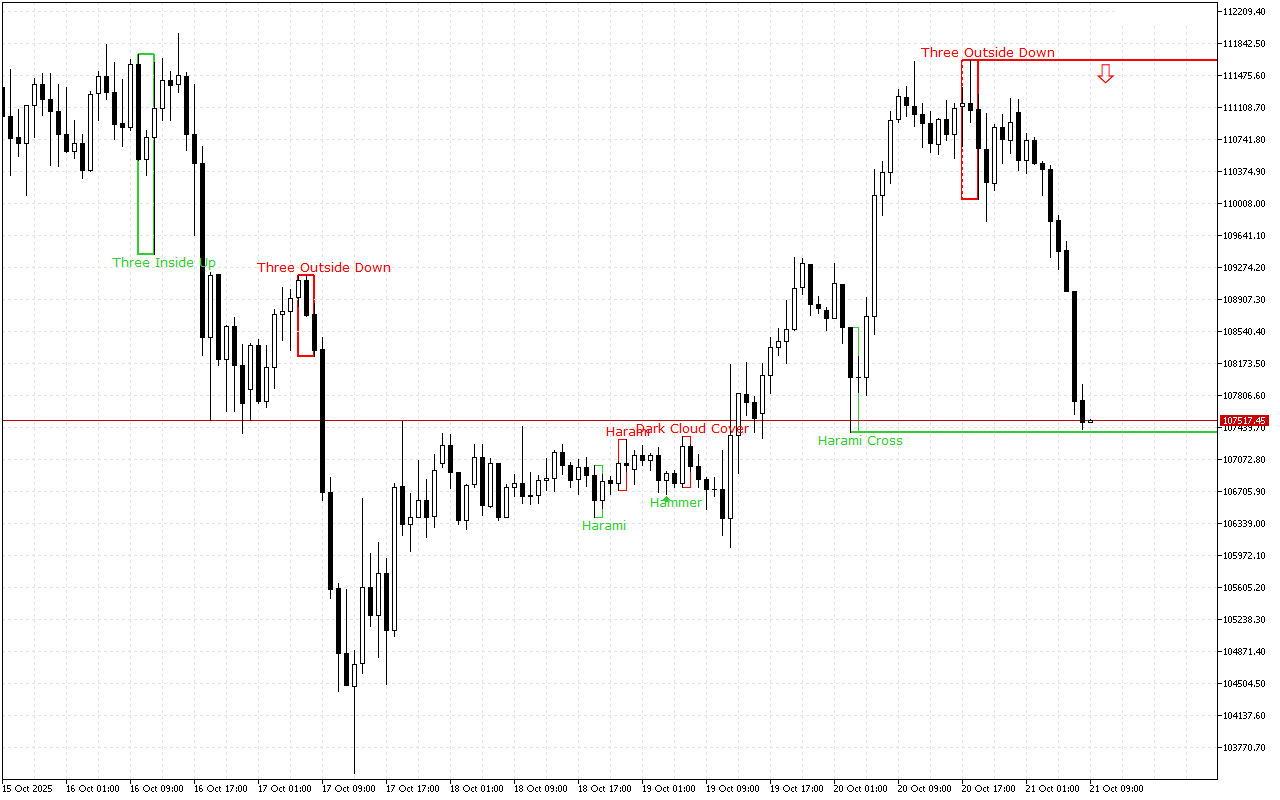
The nearest support is set at the 107376.75 mark.
This level was formed by the Bullish Harami Cross pattern. This pattern is presented with the combination of two Japanese candles: the first one is the candle with a long real body and the second one, the doji, is located inside the body of the first candle.
The nearest resistance is set at the 111645.25 mark.
The pattern formed here is Three Outside Bars Down. This pattern is a combination of three Japanese candlesticks. The first candlestick has a short white real body, the second candlestick has a long black real body and completely engulfs the first candlestick, and the third candlestick is also black, closing below the second candlestick.
Trading recommendations:
The latest pattern formed on the chart prioritizes short positions. This signal is also proved with the price movement dynamics on the higher time-frame.
Bitcoin H1: The Price Action Forecast for the European Session on 21.10.2025
Previous Article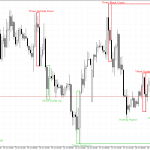 Next Article
EURGBP H1: The Price Action Forecast for the Asian Session at 21.10.2025
EURGBP H1: The Price Action Forecast for the European Session on 21.10.2025