During the previous trading session, the positive dynamics of the EURGBP movement were seen. On a longer time-frame, the upward price movement vector also prevails.
The support and resistance levels:
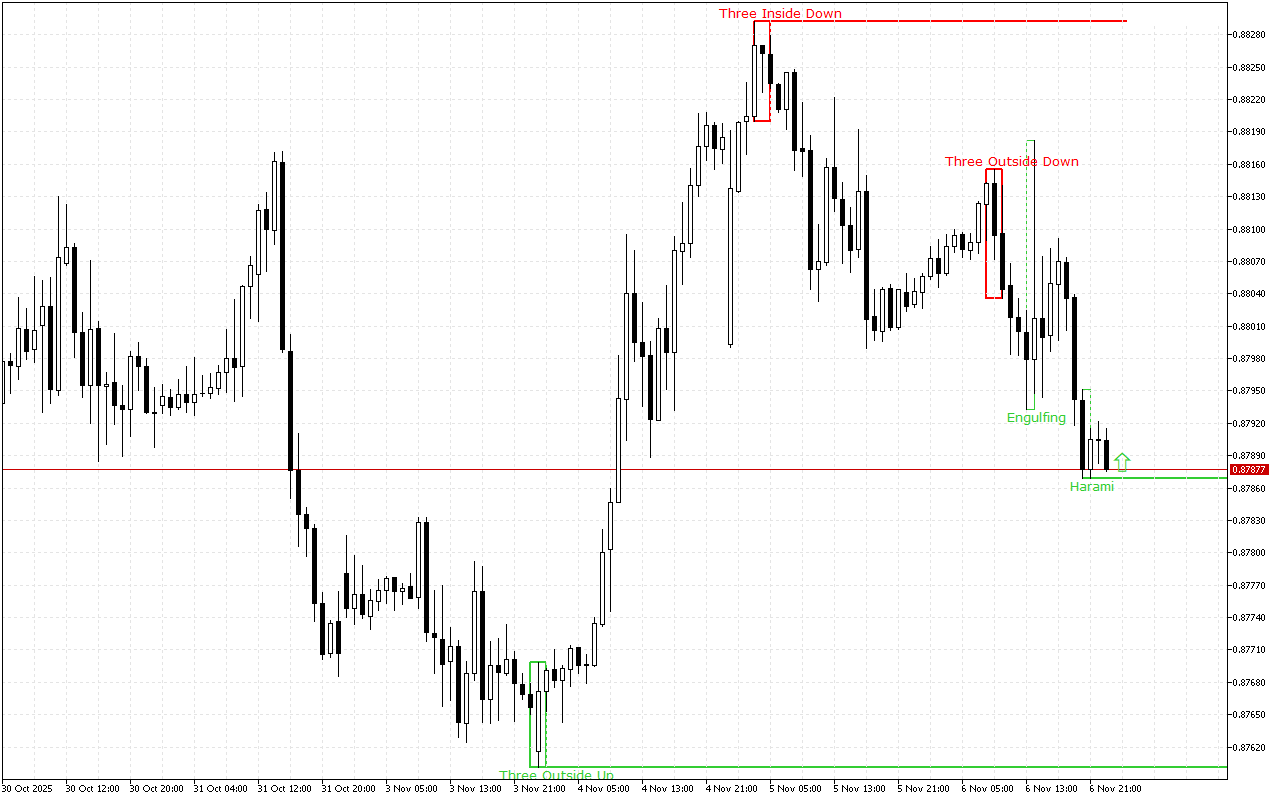
The closest support to the price is at the 0.87869 mark.
This level was formed by the Bullish Harami pattern. The pattern is represented with two Japanese candles, where the second one with a smaller real body is inside the body of the first one.
The nearest resistance level is at the level of the 0.88292.
This level was formed by the Three Inside Down pattern. This pattern consists of three Japanese candles: the first candle has a short black real body, the second candle also has a black real body and is completely inside the body of the first candle, and the third candle is also black and closes below the body of the second candle.
Trading recommendations:
The price movement dynamics for a longer period of time as well as the latest signals on the chart indicate the long positions opening intraday. The entry points can be considered from the nearest support levels.
EURGBP H1: The Price Action Forecast for the Asian Session at 7.11.2025
Previous Article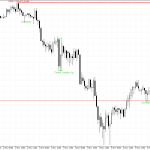 Next Article
Bitcoin H1: The Price Action Forecast for the American Session on 6.11.2025
Bitcoin H1: The Price Action Forecast for the Asian Session at 7.11.2025