During the previous trading session, the price of Bitcoin decreased, moving in the main trend direction on the higher time-frame.
The support and resistance levels:
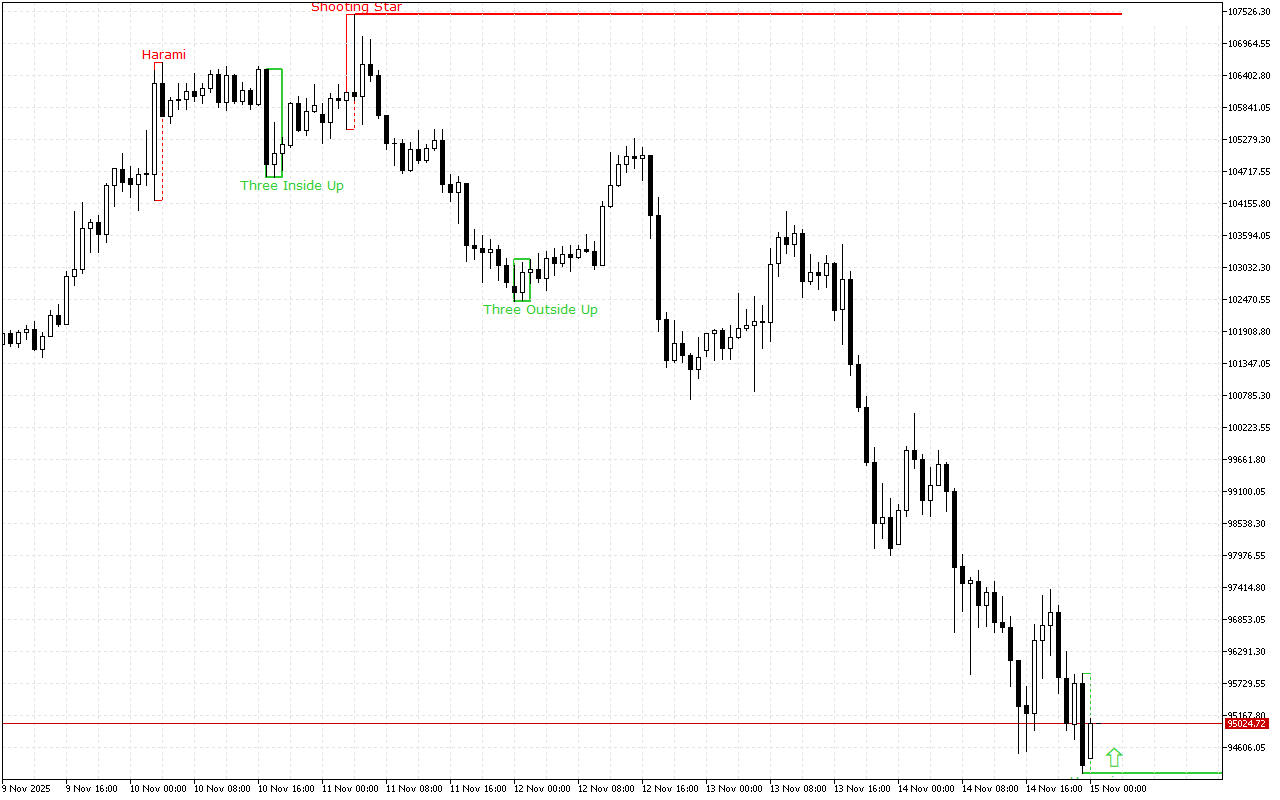
The nearest support is set at the 94149.65 mark.
This level was formed by the Bullish Harami pattern. The pattern is represented with two Japanese candles, where the second one with a smaller real body is inside the body of the first one.
The nearest resistance is set at the 107473.02 mark.
The level was formed by the Shooting Star pattern. This pattern is a single candlestick which is composed of a small real body and a long upper shadow. This pattern is usually called “Pin Bar” by traders.
Trading recommendations:
The latest signal on the chart indicates the prevalence of the long positions. This signal is valid, until the other pattern is formed.
Bitcoin H1: The Price Action Forecast for the Asian Session at 15.11.2025
Previous Article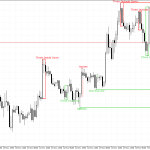 Next Article
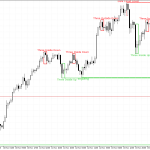
EURUSD H1: The Price Action Forecast for the Asian Session at 17.11.2025
XAUUSD H1: The Price Action Forecast for the American Session on 14.11.2025