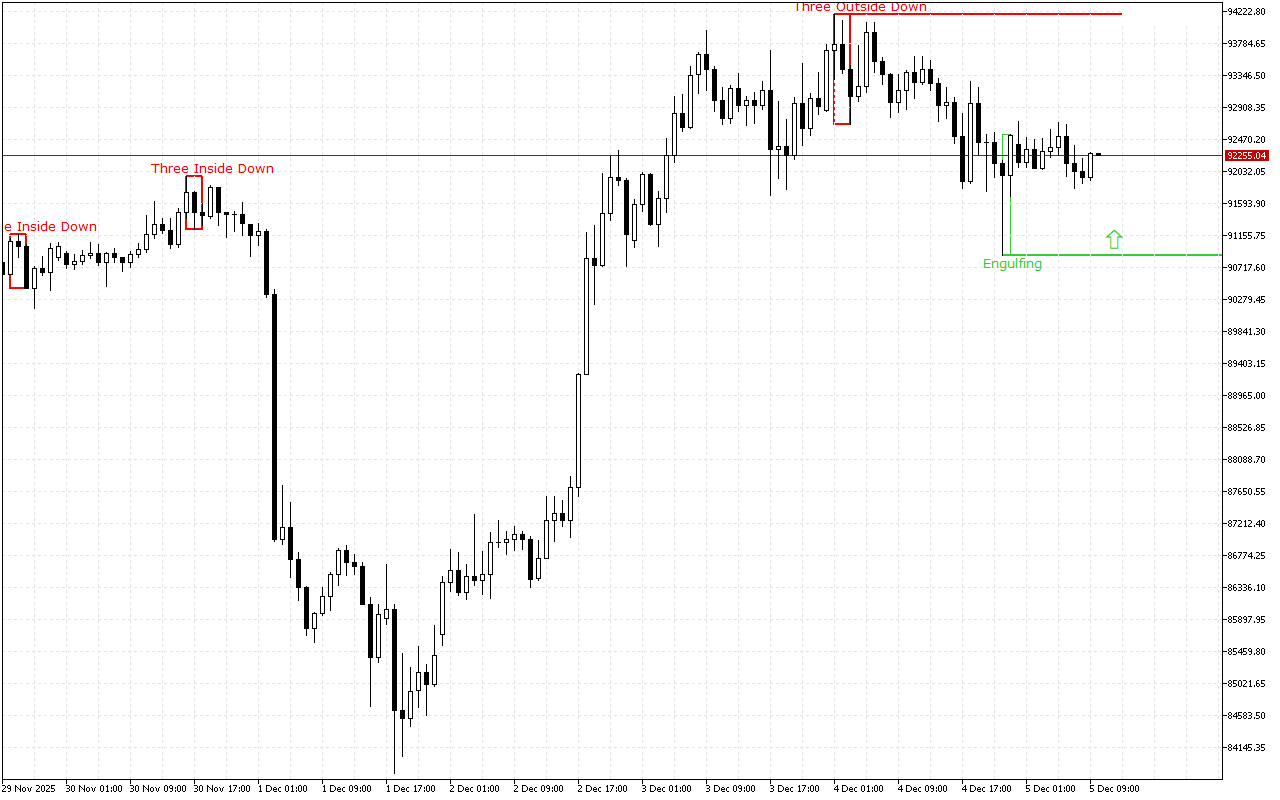
During the previous trading session, Bitcoin demonstrated downward dynamics. On a longer time-frame, the upward trend still prevails.
The support and resistance levels:
The closest support to the price is at the 90885.22 mark.
This level was formed by the Bullish Engulfing pattern. The pattern consists of two candles: the first one is inside the body of the second one, which is much larger. The second candle completely engulfs the first one.
The nearest resistance level is at the level of the 94181.47.
The pattern formed here is Three Outside Bars Down. This pattern is a combination of three Japanese candlesticks. The first candlestick has a short white real body, the second candlestick has a long black real body and completely engulfs the first candlestick, and the third candlestick is also black, closing below the second candlestick.
Trading recommendations:
The price movement dynamics for a longer period of time as well as the latest signals on the chart indicate the long positions opening intraday. The entry points can be considered from the nearest support levels.
Bitcoin H1: The Price Action Forecast for the European Session on 5.12.2025
Previous Article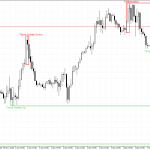 Next Article
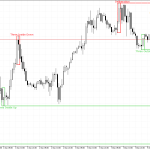
EURUSD H1: The Price Action Forecast for the European Session on 5.12.2025
EURUSD H1: The Price Action Forecast for the American Session on 5.12.2025