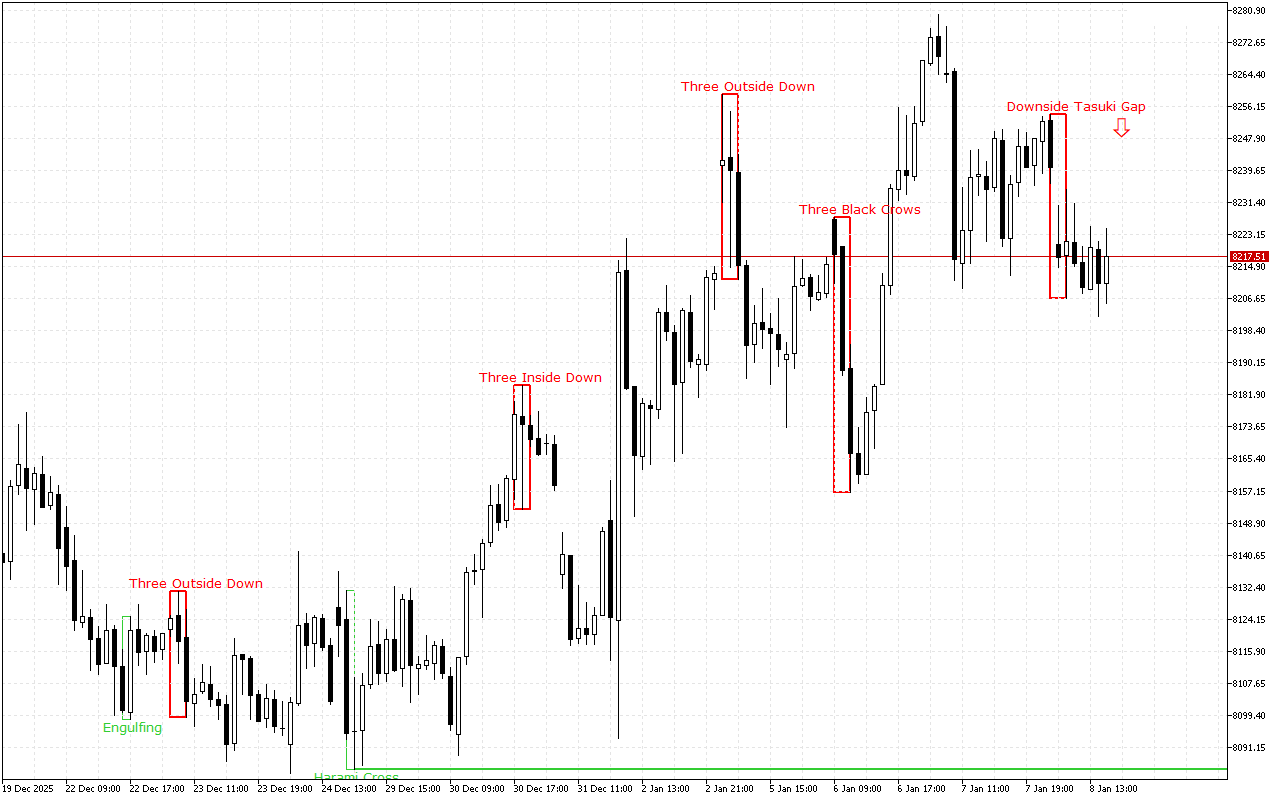
During the previous trading session, CAC 40 demonstrated downward dynamics. On a longer time-frame, the upward trend still prevails.
The support and resistance levels:
The closest support to the price is at the 8085.38 mark.
This level was formed by the Bullish Harami Cross pattern. This pattern is presented with the combination of two Japanese candles: the first one is the candle with a long real body and the second one, the doji, is located inside the body of the first candle.
The nearest resistance level is at the level of the 8254.04.
The Bearish Upside Tasuki Gap pattern formed this level. It consists of three Japanese candles: the first candle has a long black real body, the second candle also has a black real body and opens with a gap up, the third candle is white and opens inside the body of the second candle and closes above its middle, but below the gap. This pattern indicates a continuation of the downtrend.
Trading recommendations:
The latest signal prioritizes short positions intraday.
CAC 40 H1: The Price Action Forecast for the American Session on 8.1.2026
Previous Article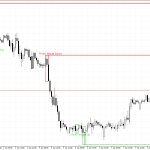 Next Article
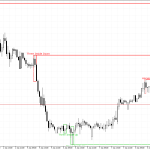
EURGBP H1: The Price Action Forecast for the American Session on 8.1.2026
EURGBP H1: The Price Action Forecast for the Asian Session at 9.1.2026