During the previous trading session, the price of CAC 40 decreased, moving in the main trend direction on the higher time-frame.
The support and resistance levels:
The nearest support is set at the 7995.13 mark.
The Bullish Doji Star pattern has formed here. This pattern is a combination of two Japanese candlesticks. The first candle is with a long real body, and the second candle is a doji, which opens with a gap up.
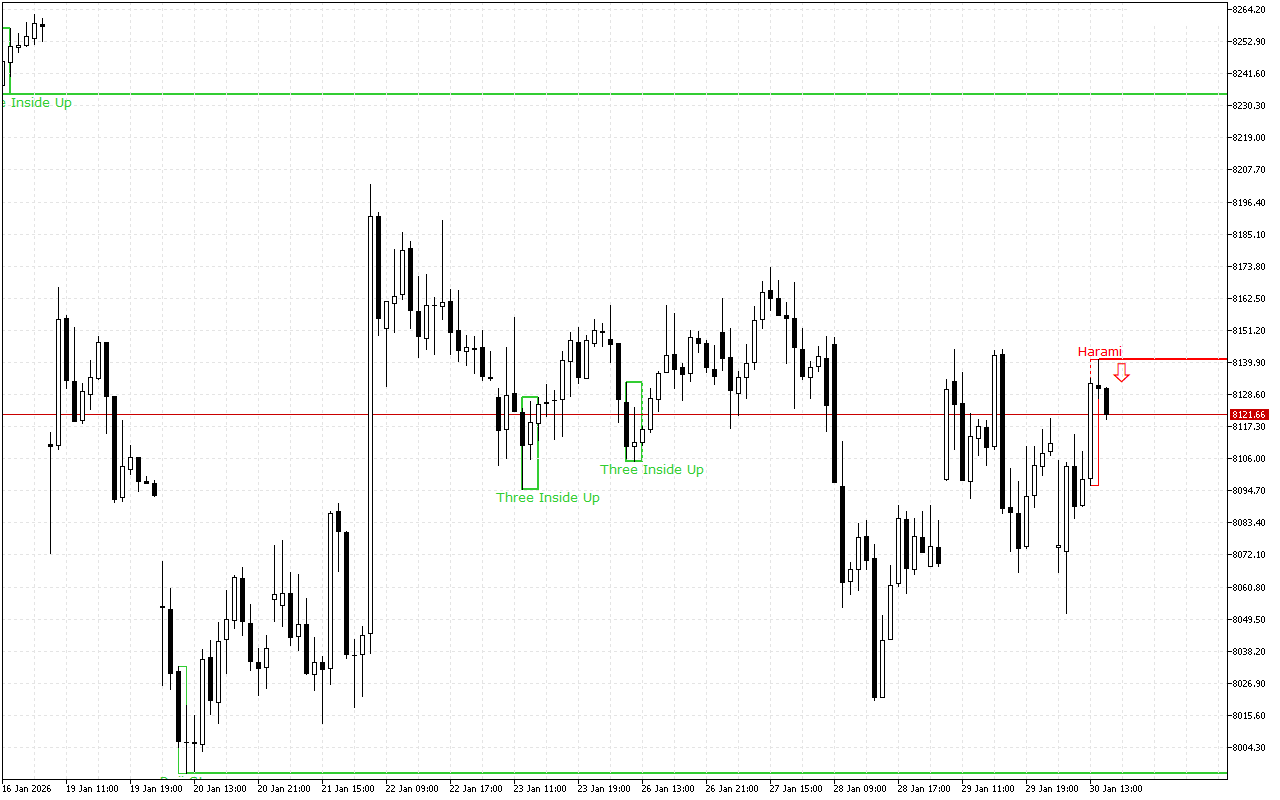
The nearest resistance is set at the 8140.85 mark.
This level was formed by the Bearish Harami pattern, which is presented with two Japanese candlesticks where the second candlestick with a smaller real body is inside the body of the first one.
Trading recommendations:
The latest pattern formed on the chart prioritizes short positions. This signal is also proved with the price movement dynamics on the higher time-frame.
CAC 40 H1: The Price Action Forecast for the American Session on 30.1.2026