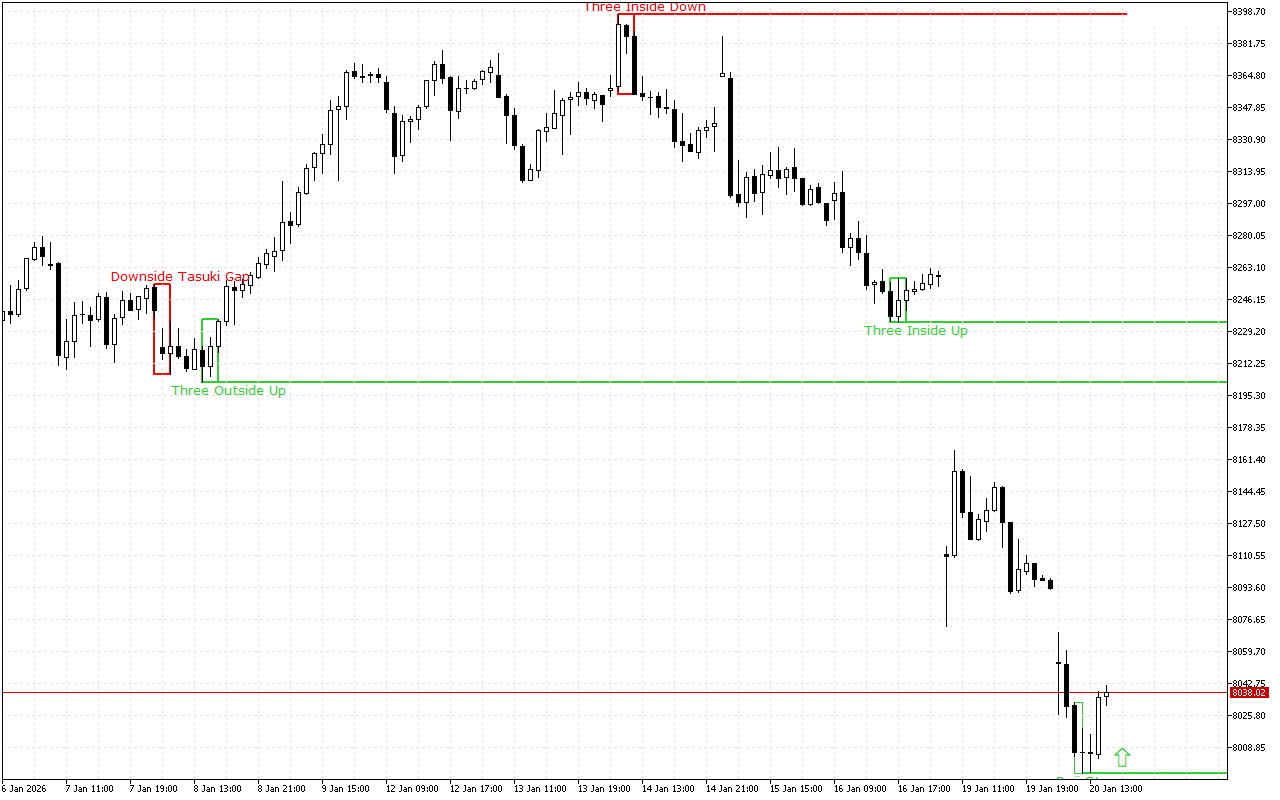
CAC 40 closes the last trading session in the green zone, while the downward price movement vector prevails on the higher time-frame.
The support and resistance levels:
The nearest support is set at the 7995.13 mark.
The Bullish Doji Star pattern has formed here. This pattern is a combination of two Japanese candlesticks. The first candle is with a long real body, and the second candle is a doji, which opens with a gap up.
The nearest resistance is set at the 8397.16 mark.
This level was formed by the Three Inside Down pattern. This pattern consists of three Japanese candles: the first candle has a short black real body, the second candle also has a black real body and is completely inside the body of the first candle, and the third candle is also black and closes below the body of the second candle.
Trading recommendations:
Despite the downward dynamics prevail on a higher time-frame, the long position should be prioritized intraday. The latest signal on the chart indicates the prevalence of the upward movement intraday.
CAC 40 H1: The Price Action Forecast for the American Session on 20.1.2026
Previous Article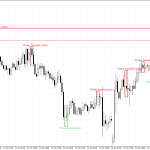 Next Article
EURUSD H1: The Price Action Forecast for the European Session on 20.1.2026
EURGBP H1: The Price Action Forecast for the American Session on 20.1.2026