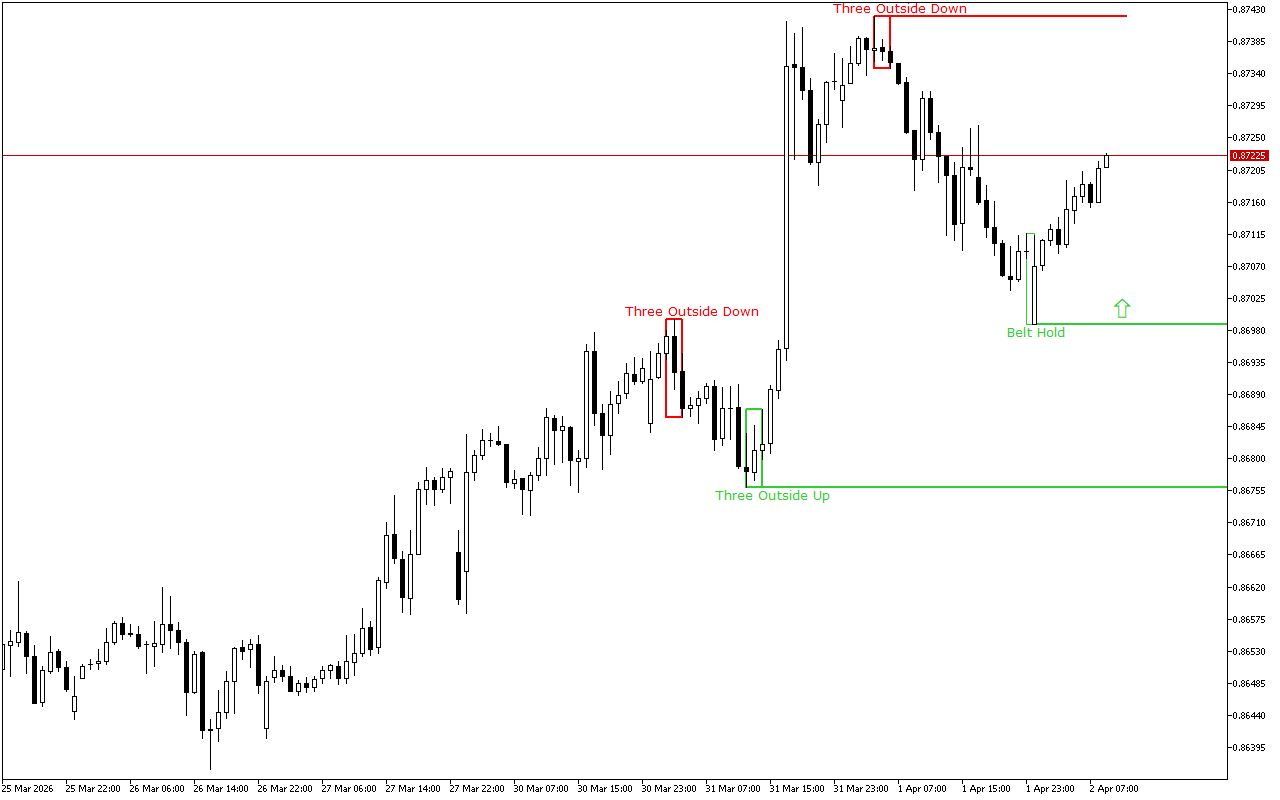
During the previous trading session, the positive dynamics of the EURGBP movement were seen. On a longer time-frame, the upward price movement vector also prevails.
The support and resistance levels:
The closest support to the price is at the 0.86988 mark.
This level is formed by the Bullish Belt Hold pattern. It consists of one candle with a long white body. Its opening is at the day’s low. This pattern occurs after a downward movement and indicates a potential price growth.
The nearest resistance level is at the level of the 0.8742.
The pattern formed here is Three Outside Bars Down. This pattern is a combination of three Japanese candlesticks. The first candlestick has a short white real body, the second candlestick has a long black real body and completely engulfs the first candlestick, and the third candlestick is also black, closing below the second candlestick.
Trading recommendations:
On the higher time-frame, the upward price dynamics prevail. The last signal on the chart also indicates the upcoming growth. Against this background, it is worth prioritizing the buy signals during the day.
EURGBP H1: The Price Action Forecast for the European Session on 2.4.2026
Previous Article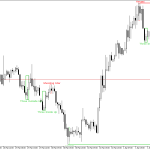 Next Article
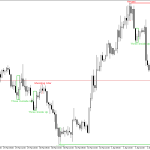
EURUSD H1: The Price Action Forecast for the European Session on 2.4.2026
EURUSD H1: The Price Action Forecast for the American Session on 2.4.2026