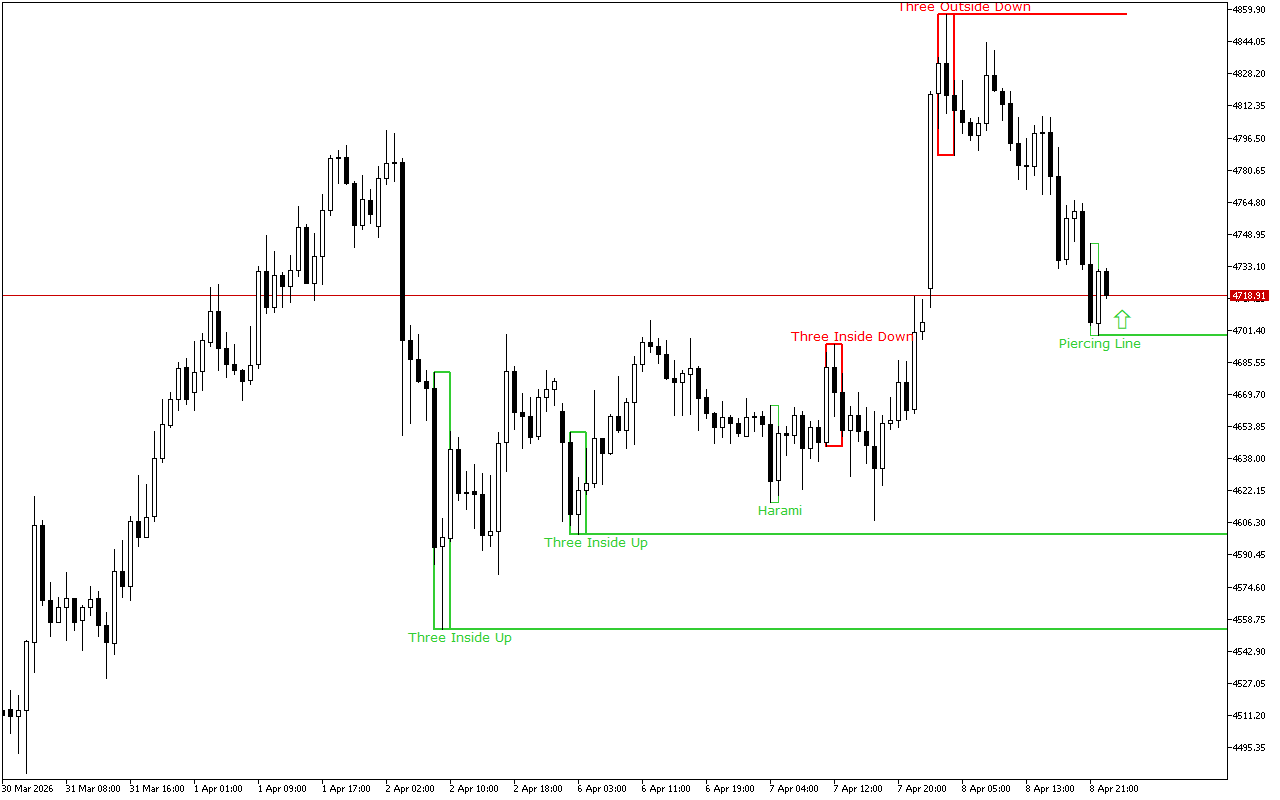
During the previous trading session, XAUUSD demonstrated downward dynamics. On a longer time-frame, the upward trend still prevails.
The support and resistance levels:
The nearest support level is at the price level of the 4699.01.
The Penetrating Line pattern formed this level. The pattern consists of two candles: the first one has a long black body, the second one has a white body. The second candle opens with a gap down and closes above the middle of the first candle’s body.
The nearest significant resistance level is at the 4857.56 mark.
The pattern formed here is Three Outside Bars Down. This pattern is a combination of three Japanese candlesticks. The first candlestick has a short white real body, the second candlestick has a long black real body and completely engulfs the first candlestick, and the third candlestick is also black, closing below the second candlestick.
Trading recommendations:
The price movement dynamics for a longer period of time as well as the latest signals on the chart indicate the long positions opening intraday. The entry points can be considered from the nearest support levels.
XAUUSD H1: The Price Action Forecast for the Asian Session at 9.4.2026
Previous Article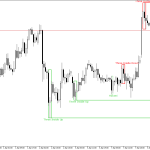 Next Article
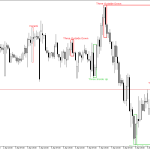
XAUUSD H1: The Price Action Forecast for the American Session on 8.4.2026
EURGBP H1: The Price Action Forecast for the European Session on 9.4.2026