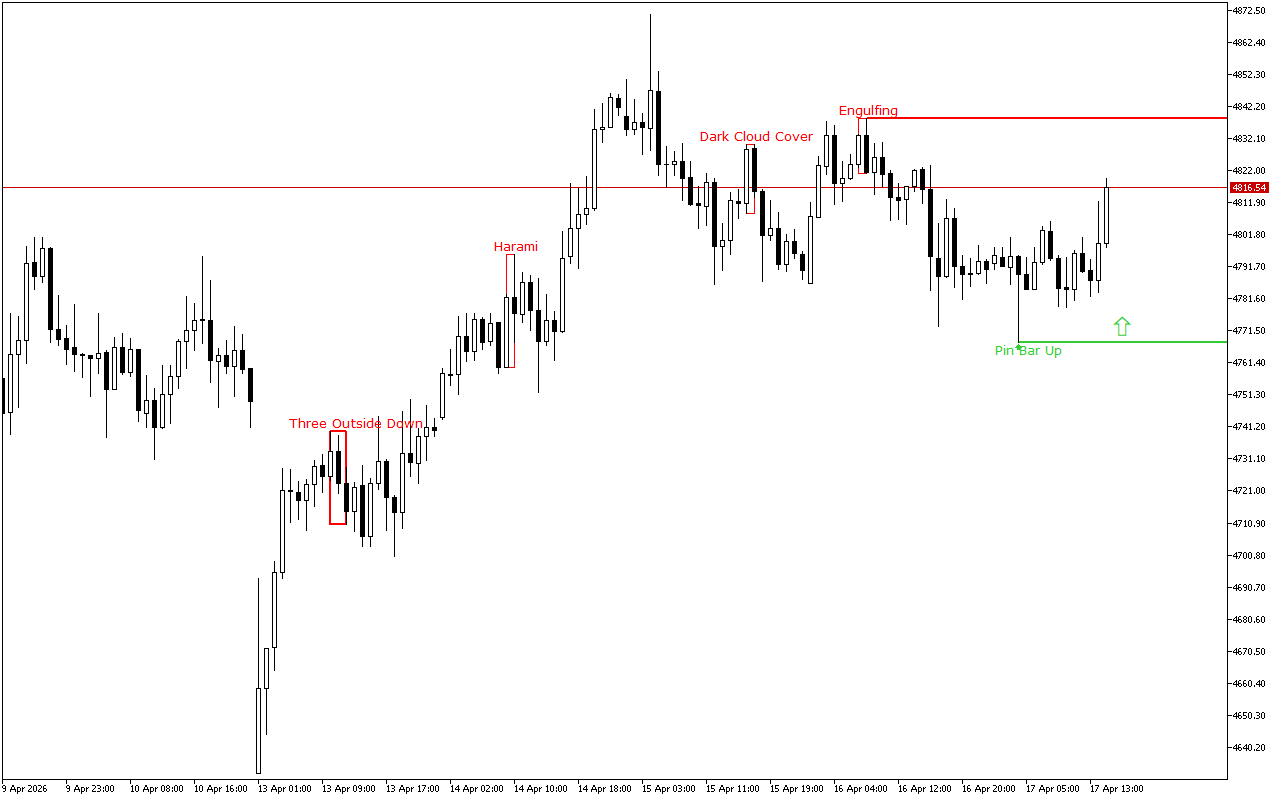
During the previous trading session, the positive dynamics of the XAUUSD movement were seen. On a longer time-frame, the upward price movement vector also prevails.
The support and resistance levels:
The nearest support level is at the price level of the 4767.82.
This level is formed due to the appearance of the Pin Bar pattern. This pattern is represented with a candle with a small real body and a long lower shadow. This pattern is quite common at strong support levels.
The nearest significant resistance level is at the 4838.28 mark.
The Bearish Engulfing pattern formed this level. It consists of two Japanese candles: the first candle is located inside the body of the second candle.
Trading recommendations:
The price movement dynamics for a longer period of time as well as the latest signals on the chart indicate the long positions opening intraday. The entry points can be considered from the nearest support levels.
XAUUSD H1: The Price Action Forecast for the American Session on 17.4.2026
Previous Article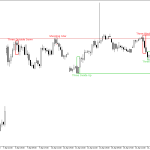 Next Article
CAC 40 H1: The Price Action Forecast for the American Session on 17.4.2026
EURGBP H1: The Price Action Forecast for the Asian Session at 21.4.2026