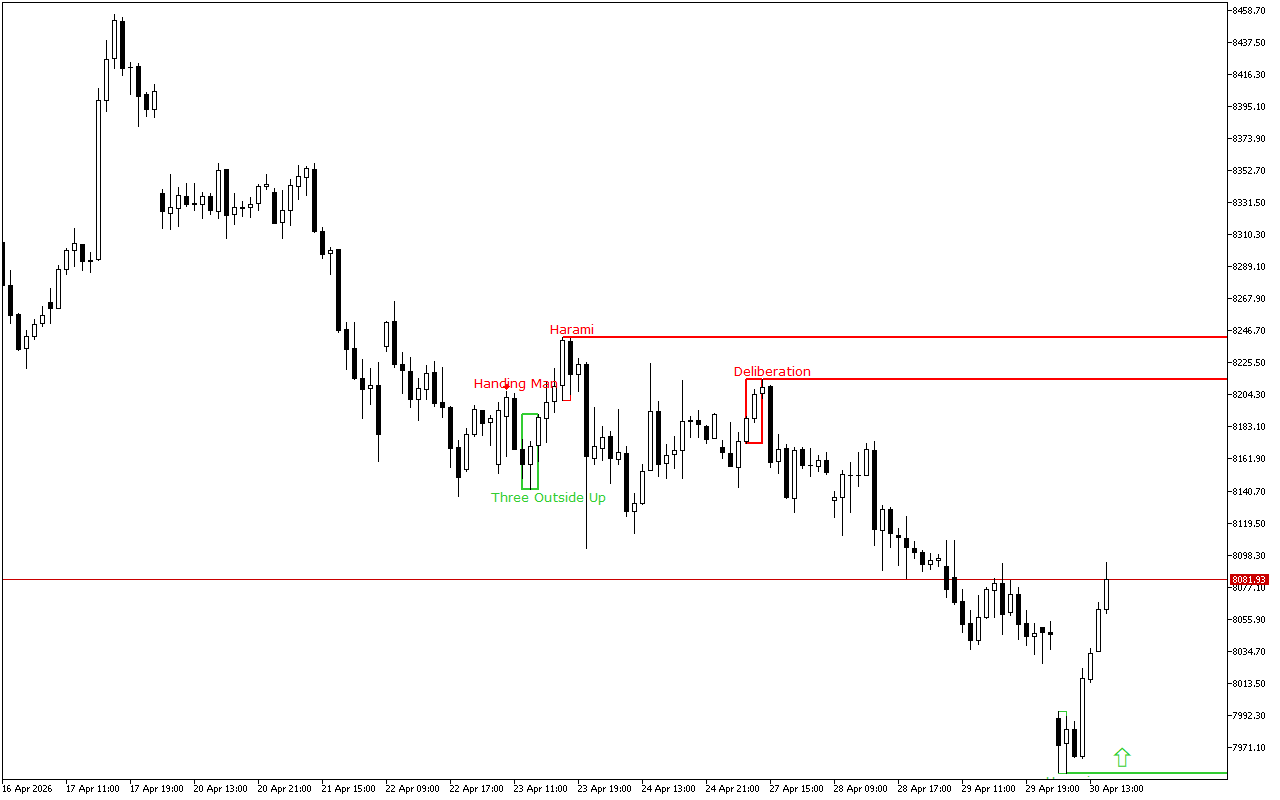
During the previous trading session, the price of CAC 40 decreased, moving in the main trend direction on the higher time-frame.
The support and resistance levels:
The nearest support is set at the 7953.96 mark.
This level was formed by the Bullish Harami pattern. The pattern is represented with two Japanese candles, where the second one with a smaller real body is inside the body of the first one.
The nearest resistance is set at the 8214.17 mark.
The Deliberation pattern occurs extremely rare on the chart. Its appearance indicates a price movement reversal downwards.
Trading recommendations:
Despite the downward dynamics prevail on a higher time-frame, the long position should be prioritized intraday. The latest signal on the chart indicates the prevalence of the upward movement intraday.
CAC 40 H1: The Price Action Forecast for the American Session on 30.4.2026
Previous Article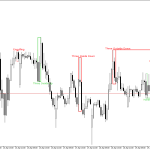 Next Article
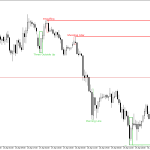
EURGBP H1: The Price Action Forecast for the Asian Session at 30.4.2026
XAUUSD H1: The Price Action Forecast for the American Session on 30.4.2026