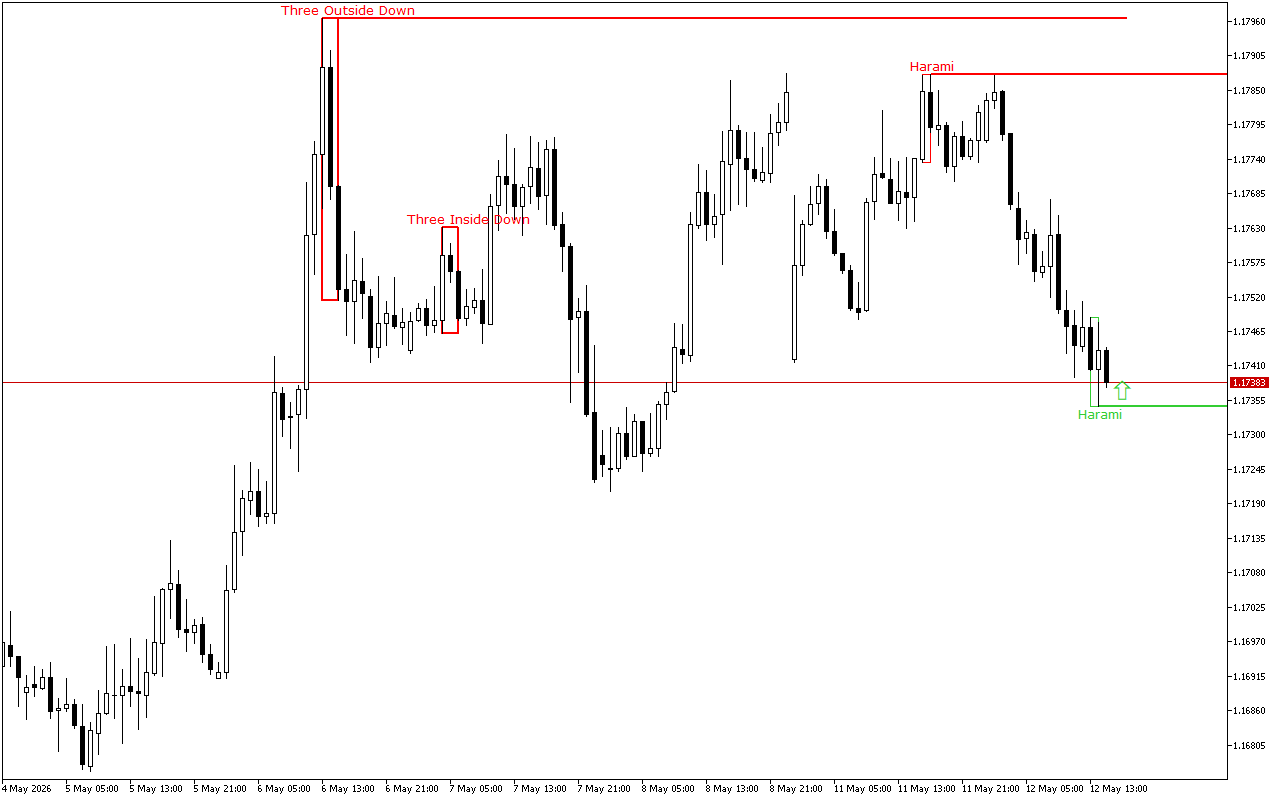
During the previous trading session, the positive dynamics of the EURUSD movement were seen. On a longer time-frame, the upward price movement vector also prevails.
The support and resistance levels:
The nearest support level is at the price level of the 1.17345.
This level was formed by the Bullish Harami pattern. The pattern is represented with two Japanese candles, where the second one with a smaller real body is inside the body of the first one.
The nearest significant resistance level is at the 1.17875 mark.
This level was formed by the Bearish Harami pattern, which is presented with two Japanese candlesticks where the second candlestick with a smaller real body is inside the body of the first one.
Trading recommendations:
On the higher time-frame, the upward price dynamics prevail. The last signal on the chart also indicates the upcoming growth. Against this background, it is worth prioritizing the buy signals during the day.
EURUSD H1: The Price Action Forecast for the American Session on 12.5.2026
Previous Article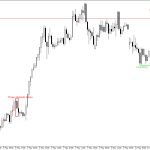 Next Article
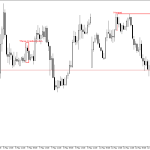
XAUUSD H1: The Price Action Forecast for the Asian Session at 12.5.2026
EURUSD H1: The Price Action Forecast for the Asian Session at 13.5.2026