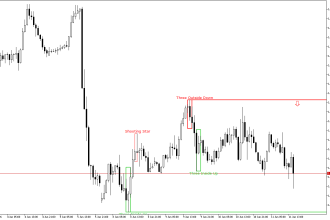
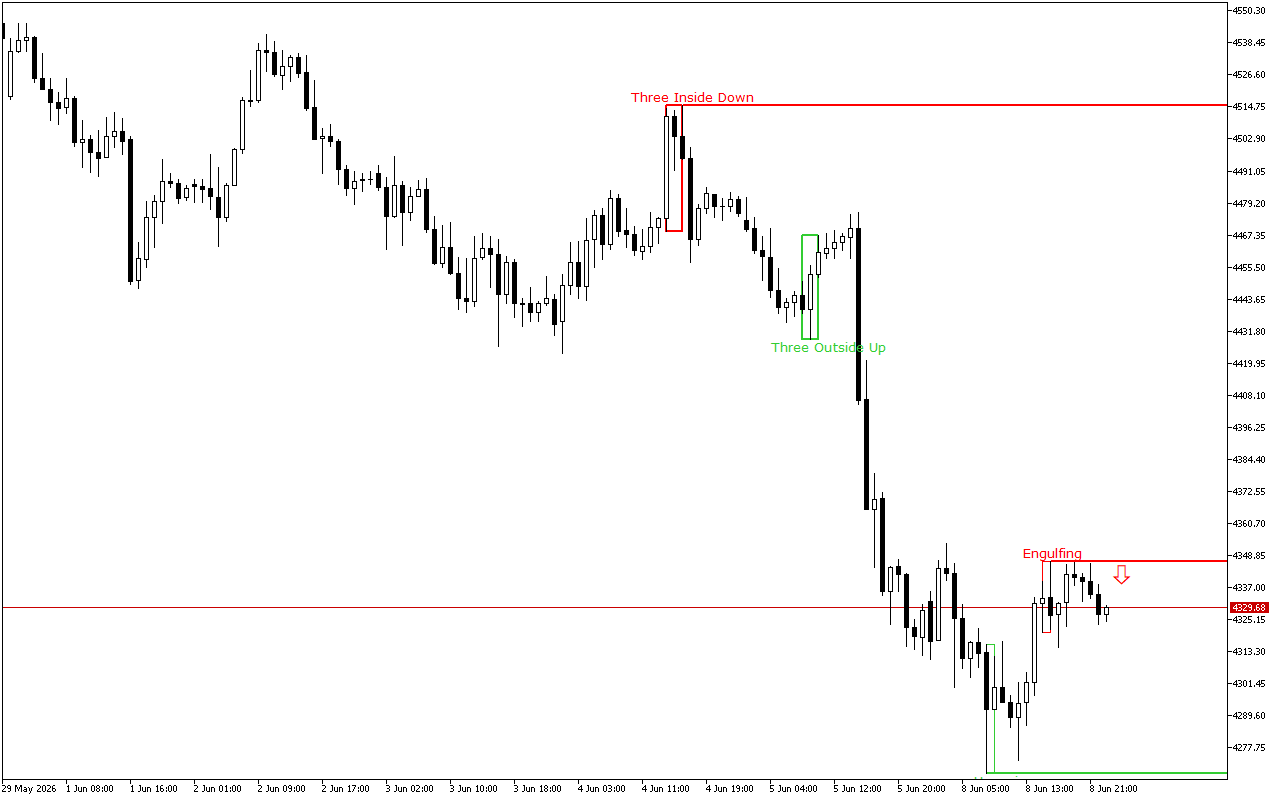
During the previous trading session, the price of XAUUSD decreased, moving in the main trend direction on the higher time-frame.
The support and resistance levels:
The closest support to the price is at the 4268.16 mark.
This level was formed by the Bullish Harami pattern. The pattern is represented with two Japanese candles, where the second one with a smaller real body is inside the body of the first one.
The nearest resistance level is at the level of the 4346.48.
The Bearish Engulfing pattern formed this level. It consists of two Japanese candles: the first candle is located inside the body of the second candle.
Trading recommendations:
The latest pattern formed on the chart prioritizes short positions. This signal is also proved with the price movement dynamics on the higher time-frame.
XAUUSD H1: The Price Action Forecast for the Asian Session at 9.6.2026
Previous Article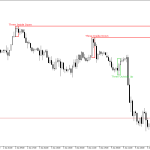 Next Article
XAUUSD H1: The Price Action Forecast for the American Session on 8.6.2026
EURUSD H1: The Price Action Forecast for the Asian Session at 9.6.2026