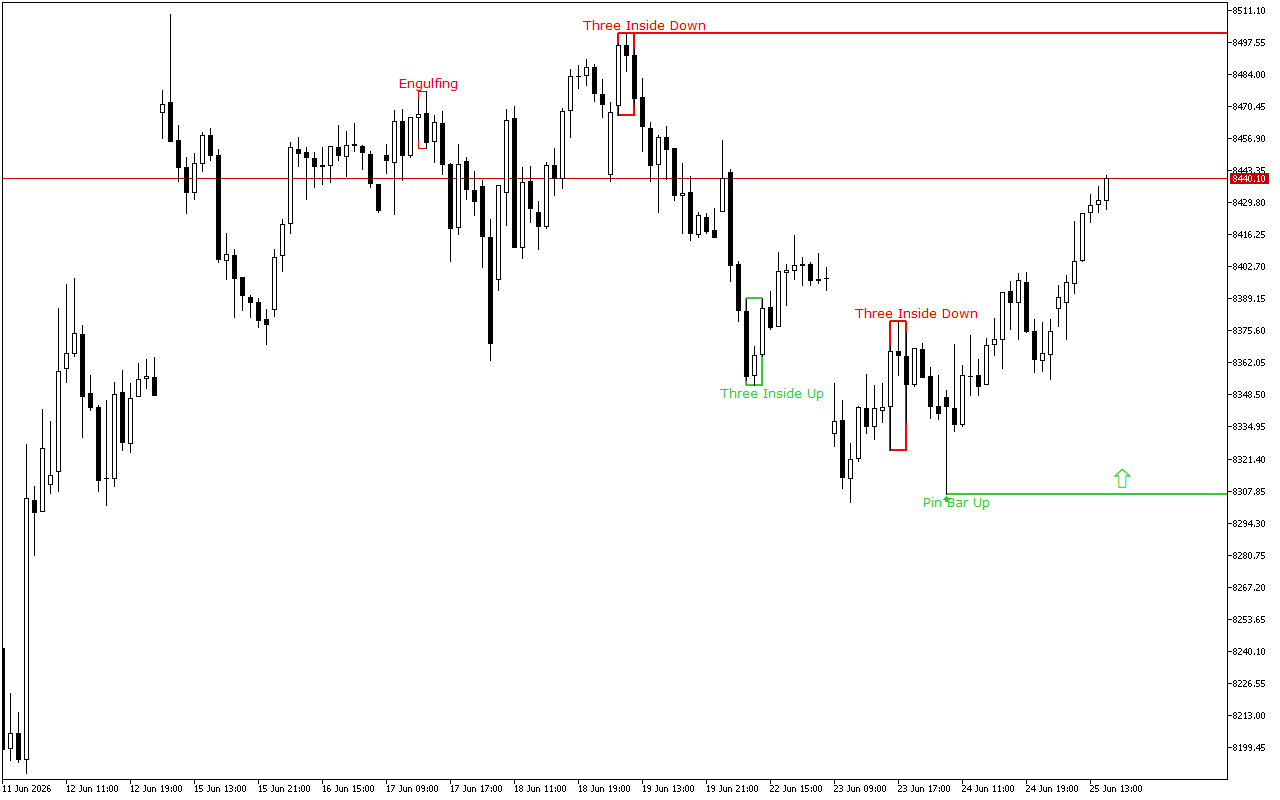
During the previous trading session, the positive dynamics of the CAC 40 movement were seen. On a longer time-frame, the upward price movement vector also prevails.
The support and resistance levels:
The nearest support level is at the price level of the 8306.38.
This level is formed due to the appearance of the Pin Bar pattern. This pattern is represented with a candle with a small real body and a long lower shadow. This pattern is quite common at strong support levels.
The nearest significant resistance level is at the 8501.16 mark.
Trading recommendations:
On the higher time-frame, the upward price dynamics prevail. The last signal on the chart also indicates the upcoming growth. Against this background, it is worth prioritizing the buy signals during the day.
CAC 40 H1: The Price Action Forecast for the American Session on 25.6.2026
Previous Article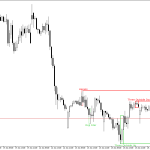 Next Article
EURGBP H1: The Price Action Forecast for the American Session on 25.6.2026
XAUUSD H1: The Price Action Forecast for the American Session on 25.6.2026