During the previous trading session, the positive dynamics of the CAC 40 movement were seen. On a longer time-frame, the upward price movement vector also prevails.
The support and resistance levels:
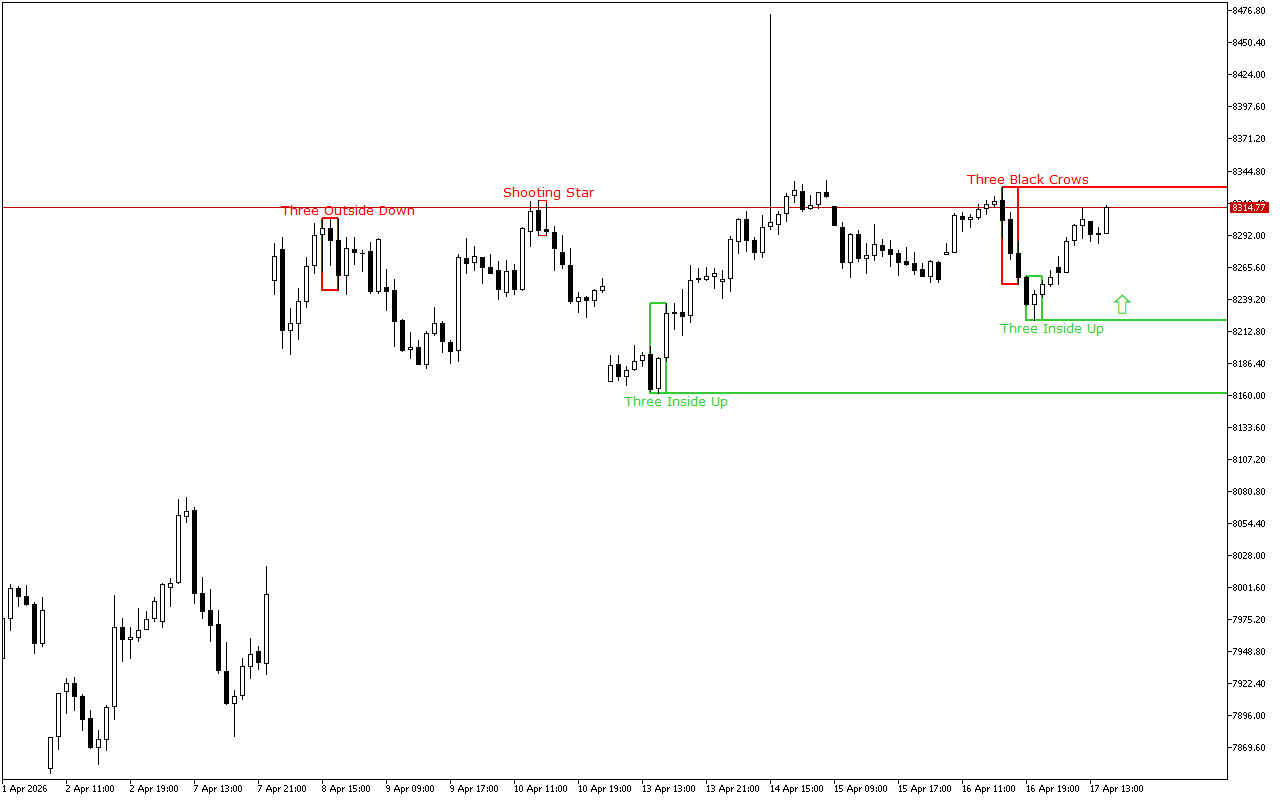
The nearest support level is at the price level of the 8221.67.
This level was formed by the Three Inside Up pattern. This pattern consists of three Japanese candles: the first candle has a short white real body, the second candle has a white real body and is completely inside the body of the first candle, and the third candle is also white and closes above the body of the second candle.
The nearest significant resistance level is at the 8331.14 mark.
The Three Black Crows pattern formed this level. It consists of three consecutive black long-bodied Japanese candlesticks that open inside the body of the previous candle and close below its closing.
Trading recommendations:
The price movement dynamics for a longer period of time as well as the latest signals on the chart indicate the long positions opening intraday. The entry points can be considered from the nearest support levels.
CAC 40 H1: The Price Action Forecast for the American Session on 17.4.2026
Previous Article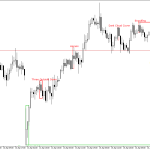 Next Article
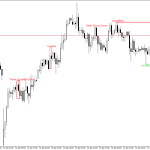
XAUUSD H1: The Price Action Forecast for the Asian Session at 17.4.2026
XAUUSD H1: The Price Action Forecast for the American Session on 17.4.2026