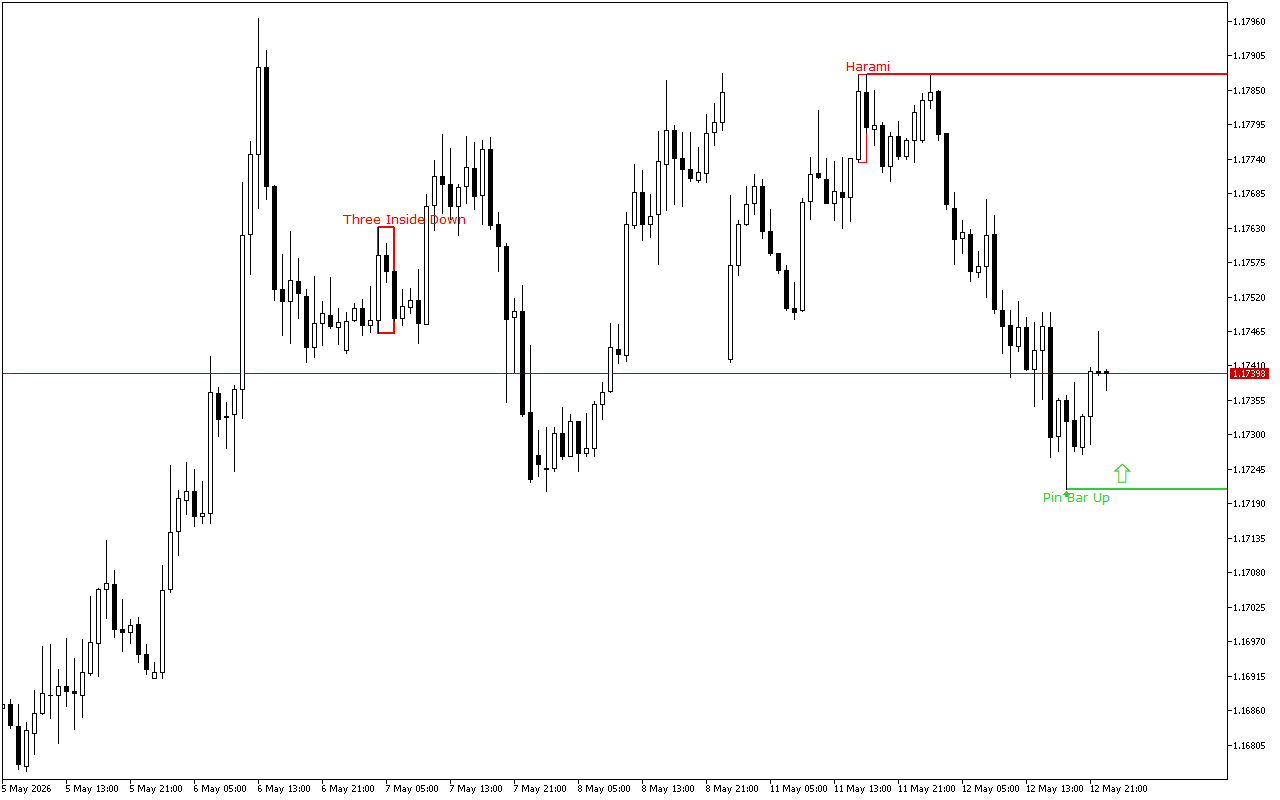
During the previous trading session, the positive dynamics of the EURUSD movement were seen. On a longer time-frame, the upward price movement vector also prevails.
The support and resistance levels:
The nearest support is set at the 1.17213 mark.
This level is formed due to the appearance of the Pin Bar pattern. This pattern is represented with a candle with a small real body and a long lower shadow. This pattern is quite common at strong support levels.
The nearest resistance is set at the 1.17875 mark.
This level was formed by the Bearish Harami pattern, which is presented with two Japanese candlesticks where the second candlestick with a smaller real body is inside the body of the first one.
Trading recommendations:
The price movement dynamics for a longer period of time as well as the latest signals on the chart indicate the long positions opening intraday. The entry points can be considered from the nearest support levels.
EURUSD H1: The Price Action Forecast for the Asian Session at 13.5.2026
Previous Article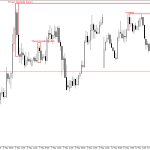 Next Article
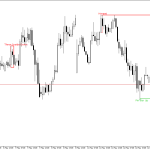
EURUSD H1: The Price Action Forecast for the American Session on 12.5.2026
EURUSD H1: The Price Action Forecast for the European Session on 13.5.2026